


الوصف
يرسم Apex Break PRO خطوط الاتجاه المهمة ويسجل كل اختراق لها.
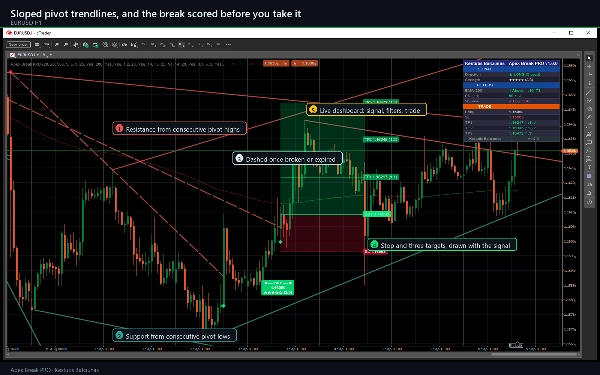
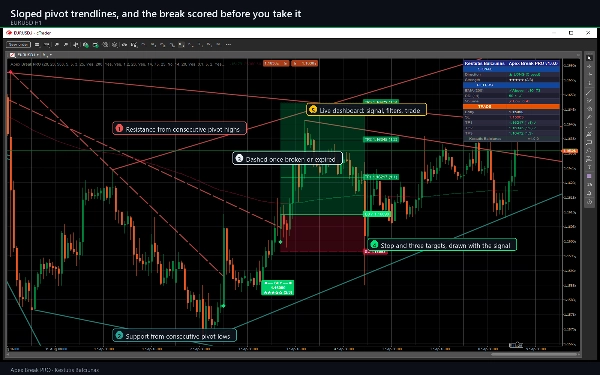
تشكل قمم المحاور المتتالية خط مقاومة مائل، وقيعان المحاور المتتالية خط دعم مائل. هذه ليست مستويات أفقية: فهي تتبع اتجاه السوق الخاص وتنتهي صلاحيتها. يظهر إشارة عندما يغلق شريط مؤكد فوق أحد هذه الخطوط بفارق يُقاس بـ ATR، وفقط عندما تتفق عدد كافٍ من المرشحات المستقلة.
ما يرسمه على الرسم البياني الخاص بك
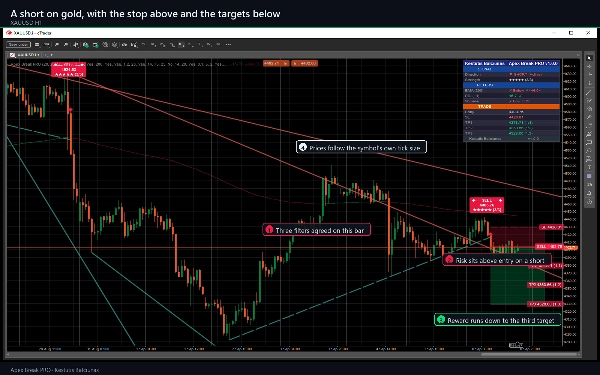
- خطوط اتجاه مقاومة ودعم مائلة، حتى خمسة من كل منها، صلبة أثناء كونها نشطة ومقطعة بمجرد كسرها أو انتهاء امتدادها.
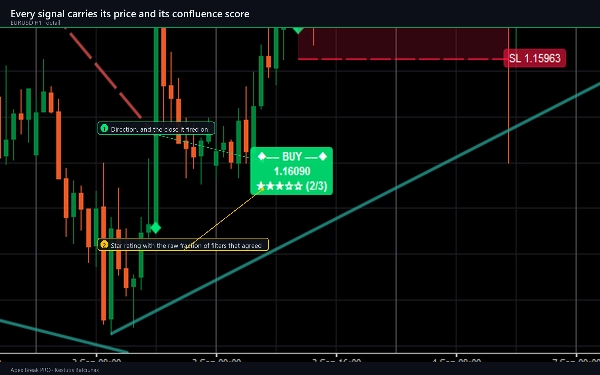
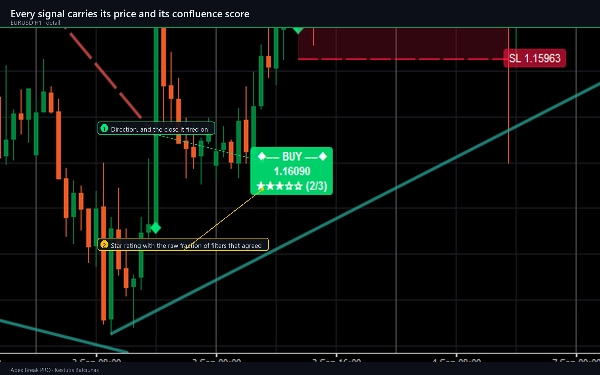
- علامة شراء أو بيع مع تسمية تحمل السعر، تقييم بخمس نجوم وجزء التقاء، على سبيل المثال 3/4.
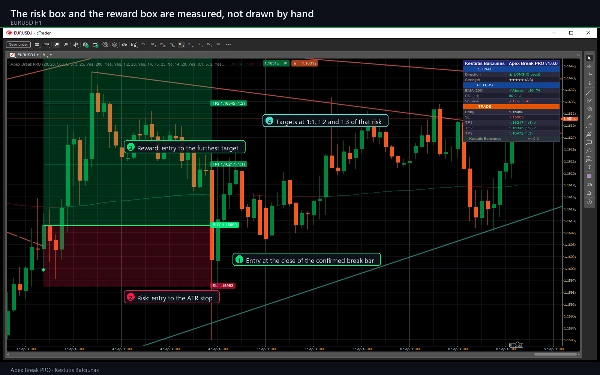
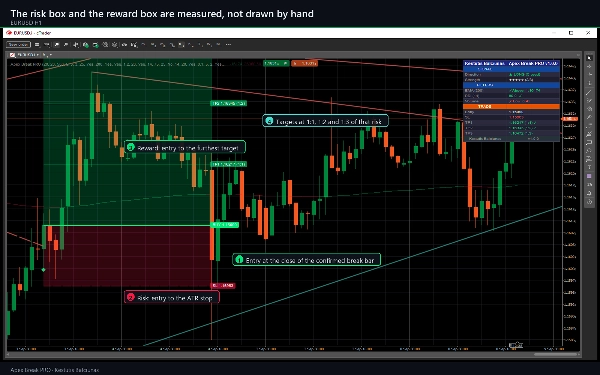
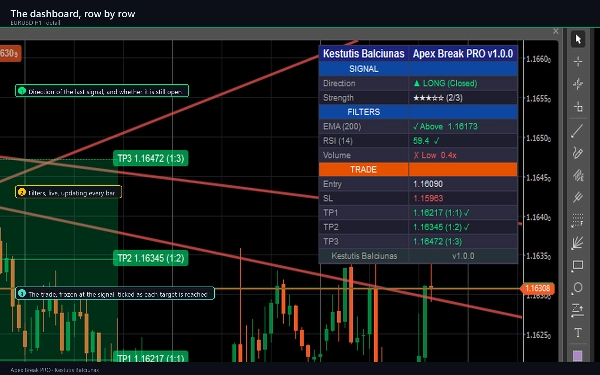
- وقف الخسارة، عند 1.5 × ATR بشكل افتراضي، وثلاثة أهداف عند 1:1، 1:2 و1:3 من تلك المسافة، مع منطقة مخاطر مظللة ومنطقة مكافأة مظللة.
- EMA 200، ملون حسب الجانب الذي يتداول عليه السعر.
- لوحة تحكم ذات عمودين مع قسم الإشارة، قسم المرشحات الحي وقسم التداول الذي يحدد كل هدف عند الوصول إليه.
كيفية التداول به
- امنحه تاريخًا. في الإعدادات الافتراضية يحتاج إلى حوالي 250 شريطًا قبل ظهور الخط الأول، لأن EMA 200 يجب أن يبدأ ويؤكد المحور بعد 20 شريطًا من تكوينه.
- انتظر العلامة. يتم تقييم الاختراق على شريط مغلق، لذلك لا تتحرك العلامة بمجرد طباعتها.
- اقرأ تقييم النجوم وصفوف المرشحات قبل أن تتصرف. يشير التقييم إلى عدد الشروط المفعلة التي اتفقت على ذلك الشريط. إنه وصف للاتفاق، وليس احتمالًا.
- استخدم وقف الخسارة والأهداف المرسومة كما هي، أو كنموذج لحجم مراكزك الخاصة.
- راقب صفوف التداول. يتم تحديد كل هدف عند وصول السعر إليه، ويتوقف التتبع عند الوقف أو الهدف الثالث.
- شغل التنبيهات التي تريدها. هناك تسعة أحداث منفصلة متاحة.
الإعدادات الرئيسية
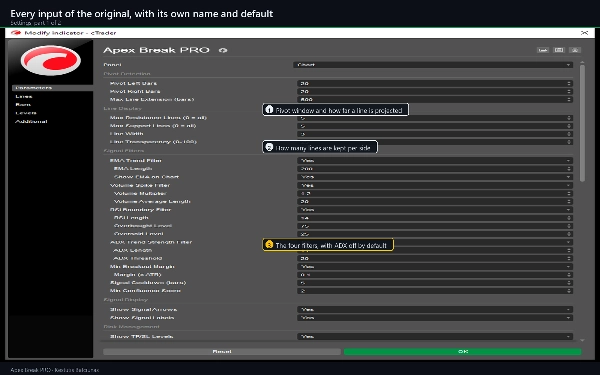
- كشف المحاور: أشرطة اليسار واليمين، كلاهما 20، وأقصى امتداد للخط 500 شريط.
- عرض الخط: حتى 5 خطوط مقاومة و5 خطوط دعم، العرض 3، الشفافية 25.
- مرشحات الإشارة: EMA 200؛ RSI 14 مع حدود 75 و25؛ الحجم 1.2x متوسطه على 20 شريطًا؛ ADX 14 فوق 20، معطل بشكل افتراضي؛ هامش اختراق 0.1 × ATR؛ فترة تبريد 5 أشرطة؛ حد أدنى للتقييم 2.
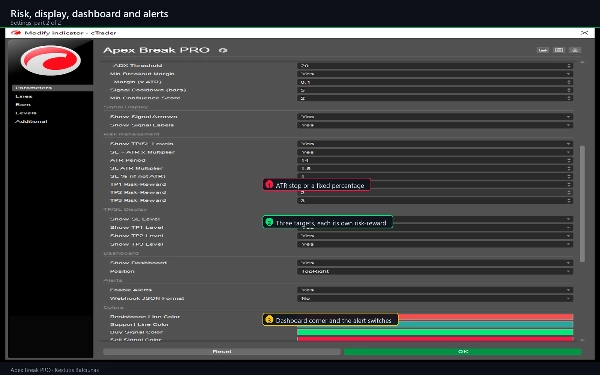
- إدارة المخاطر: ATR 14، وقف عند 1.5 × ATR أو نسبة ثابتة، الأهداف عند 1:1، 1:2 و1:3.
- لوحة التحكم في ستة مواقع، تسع مفاتيح تنبيه، وألوان الخط والإشارة الأربعة.
65 معلمة إجمالاً، عبر كشف المحاور، عرض الخط، مرشحات الإشارة، إدارة المخاطر، عرض TP/SL، لوحة التحكم، تسع مفاتيح تنبيه مع قنوات التوصيل الخاصة بها، والألوان.
نوع المؤشر، الفترات، الأدوات، حالات الاستخدام
مؤشر دعم ومقاومة، اتجاه وتقلب يرسم على الرسم البياني الرئيسي ويصدر إشارات. يعمل على أي رمز وأي إطار زمني. M15، H1 وH4 هي النوافذ التي صُمم من أجلها؛ الفترات الأقل تعطي إشارات أكثر مع وقف ATR أضيق، D1 وما فوق تعطي إشارات أقل وأوسع. يُستخدم مرشح الحجم حيث يوفره الوسيط ويمكن إيقاف تشغيله حيث لا يتوفر. الاستخدامات النموذجية: دخول اختراق خطوط الاتجاه مع التقاء محدد، وضع وقف قائم على ATR، خروج مرحلي عند 1:1، 1:2 و1:3، تأكيد الإطار الزمني الأعلى، وتغذية cBot من الإشارة المخفية.
لمن هو موجه
المتداولون الذين يرسمون خطوط الاتجاه يدويًا ويريدون رسمها بنفس الطريقة على كل رسم بياني، في كل مرة، مع تسجيل الاختراق قبل اتخاذ الإجراء. هو أداة تحليل: لا يضع أو يعدل أو يغلق أمرًا، ولا يملك وصولًا إلى حسابك.
التجربة: ما تضيفه النسخة الكاملة
التجربة هي نفس البناء، محدودة على EURUSD، بدون حد زمني وجميع المعلمات متاحة. على أي رمز آخر يظهر إشعارًا بدلاً من الرسم. النسخة الكاملة تزيل قفل الرمز: كل زوج فوركس، مؤشر، معدن، طاقة ورمز تشفير يقدمه الوسيط.
ملاحظات فنية وقيود
- يتم تقييم الإشارات على الأشرطة المغلقة ولا تعيد الرسم. يتم تأكيد المحور فقط بعد تكوين أشرطة المحور اليمنى، وهذا التأخير في التأكيد هو ثمن عدم إعادة الرسم. خطوط الاتجاه نفسها مؤقتة على الشريط الذي لا يزال يتشكل.
- التنبيهات تعمل فقط للأشرطة التي تغلق بعد إرفاق المؤشر، وليس للتاريخ.
- العلامات على صفوف الأهداف تسجل أن السعر لمس لاحقًا مستوى مرسومًا في التاريخ على الرسم البياني الخاص بك. ليست نتائج تداول: لا يوجد سبريد، عمولة، سواپ، انزلاق سعري أو تنفيذ، ولا يتم اشتقاق إحصائية منها.
- يحافظ الرسم البياني على أحدث تسميات الإشارة وخطوط الاتجاه ويقص الأقدم.
- لا يمتلك وسيطان شموعًا متطابقة، لذا تختلف الإشارات على الرسم البياني الحي عن نفس المؤشر على تغذية أخرى. هذا فرق بيانات، وليس فرق في الحساب.
- المتطلبات: cTrader 5.0 أو أحدث، تم الاختبار على 5.9. حقوق الوصول: لا شيء - لا وصول إلى الملفات، الشبكة أو التداول.
الدعم
الأسئلة من خلال تبويب المناقشة في هذه الصفحة أو اسأل البائع. التحديثات مجانية ومدرجة في سجل الإصدارات. يوفر المتجر فترة استرداد لمدة 14 يومًا. إذا كان المؤشر يعمل من أجلك، يساعد التقييم المتداولين الآخرين في العثور عليه.
التداول ينطوي على مخاطر. الأداء السابق لا يضمن النتائج المستقبلية.
الملخص
Key features include visual BUY/SELL markers with price labels, star ratings indicating filter confluence, ATR-based stops (default 1.5x ATR), and three profit targets at 1:1, 1:2, and 1:3 risk-reward ratios. It also displays a 200 EMA colored by price position, shaded risk and reward zones, and a two-column dashboard showing live signals, filters, and trade progress.
Signals are generated on confirmed closed bars without repainting, and alerts can be configured for nine different events. The indicator supports volume filtering where available and includes 65 customizable parameters covering pivot detection, line display, filters, risk management, and alerts. Apex Break PRO is intended for traders who manually draw trendlines and seek consistent, scored breakout signals for analysis and trade planning. It does not execute trades or access accounts.
















![شعار "[CB] Pivot Points Pro"](https://cdn.ctrader.com/image/webp/43463c82-67b0-4f10-a4ba-901bba091d81_32594)












