
Description
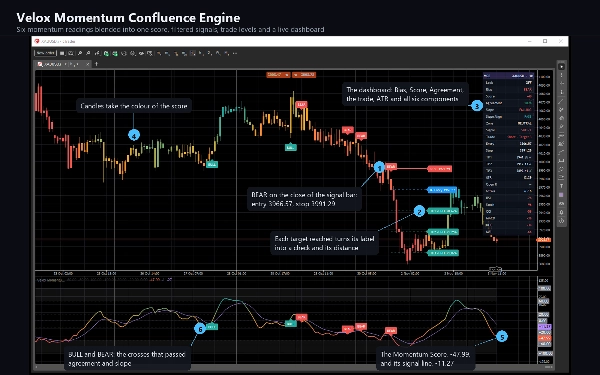
Velox Momentum Confluence Engine puts six momentum and money-flow readings on one scale and blends them into a single score from -100 to +100. Instead of six separate panes, you read one line, its signal line, and how many of the six agree with the move. A signal needs the score to cross its signal line with enough agreement behind it. Each signal can map an ATR stop and three targets, and a dashboard shows the state of every component and filter.
WHAT IT DRAWS
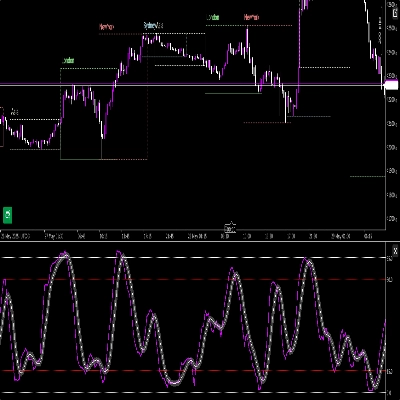
In its own pane:
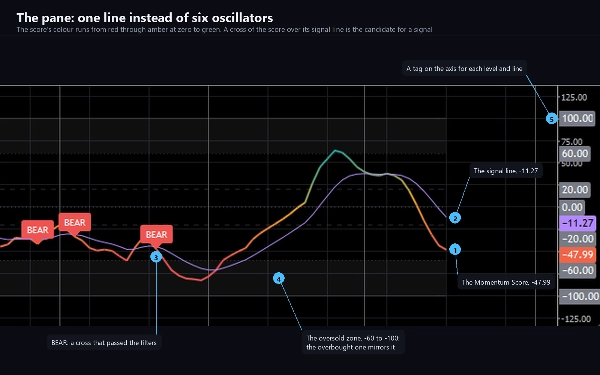
- The Momentum Score, coloured by a gradient: green toward +60, amber around zero, red toward -60.
- The violet signal line, overbought and oversold zones, threshold lines, and a value tag for every level on the axis.
- BULL and BEAR markers on accepted signals.
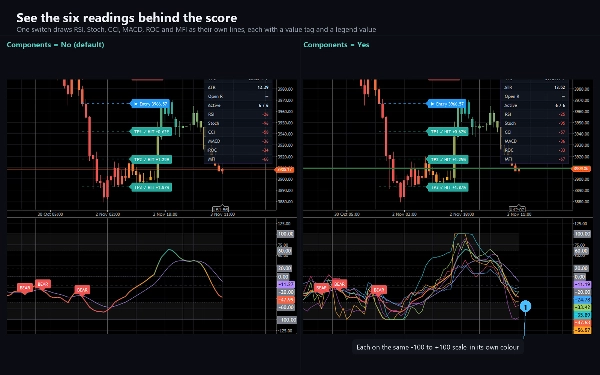
- Optional lines for each of the six components.
On the price chart:
- Candles coloured with the same gradient as the score.
- BULL and BEAR markers below and above the signal bars.
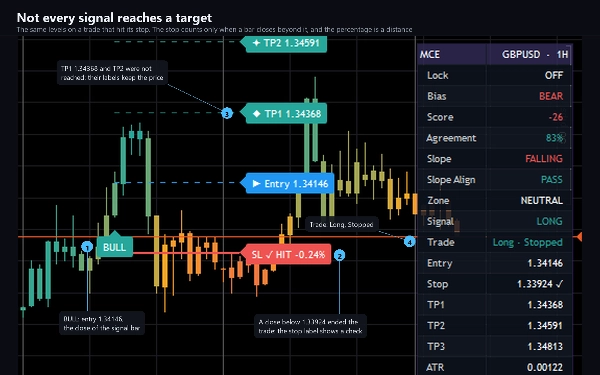
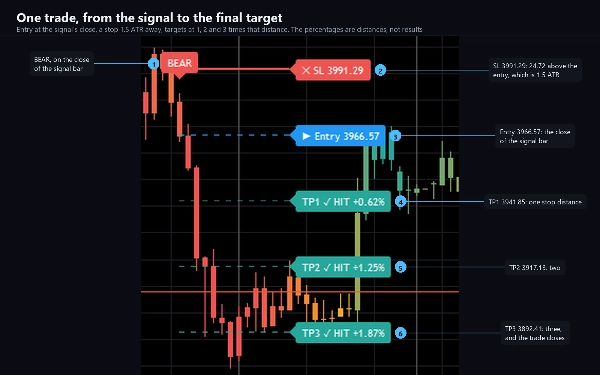
- The current trade: stop, entry and three target lines, each with a label that prints its price. When a target is touched its label changes to a check mark with the distance in percent. When a close beyond the stop ends the trade, the stop label does the same.
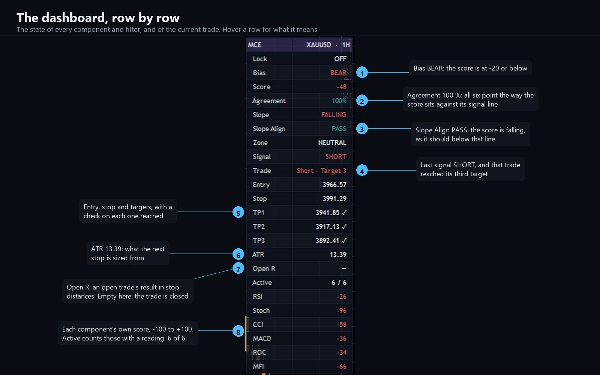
- A dashboard of up to 30 rows: Bias, Score, Agreement, Zone, Signal, the trade with its entry, stop and targets, ATR, the open result in R and each component's score. Hover a row for what it means.
HOW IT DECIDES
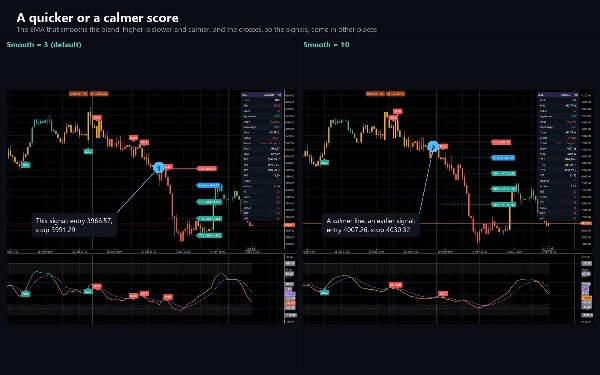
The score. RSI, the smoothed stochastic, CCI and MFI are rescaled directly. The MACD histogram and rate of change become z-scores over 100 bars. Each is then averaged by its weight, smoothed by a short EMA, and followed by a 9-bar signal line. Any component can be switched off or weighted from 0 to 10.
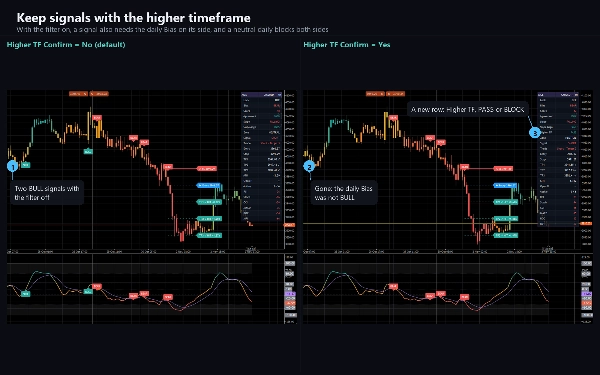
The signal. A cross of the score over its signal line is only a candidate. It becomes a BULL or BEAR marker if at least 60 % of the component weight points the same way and the score is rising or falling over the last three bars. Two more filters are off by default: a higher timeframe's Bias state, and a minimum ADX. Signals are decided when a bar closes and do not change afterwards.
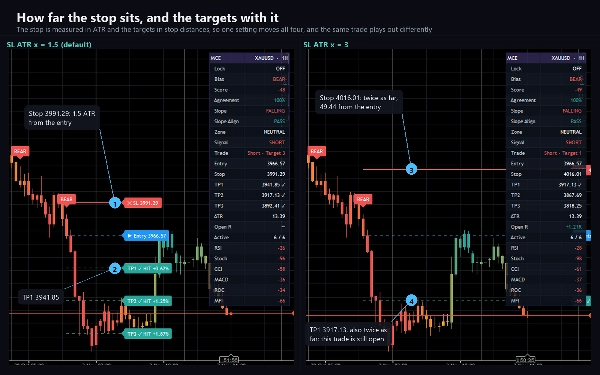
The trade. The entry is the close of the signal bar. The stop sits 1.5 ATR away, and the targets at 1, 2 and 3 times that distance. A target counts on the touch, the stop only on a close beyond it, and the third target or the stop closes the trade. A new signal replaces the trade that is open. These levels are planning references, not orders and not a forecast.
Bias reads BULL at a score of +20 or more and BEAR at -20 or less. Zone reads OVERBOUGHT at +60 or more and OVERSOLD at -60 or less. These are conditions of stretched momentum, not instructions to act.
KEY SETTINGS
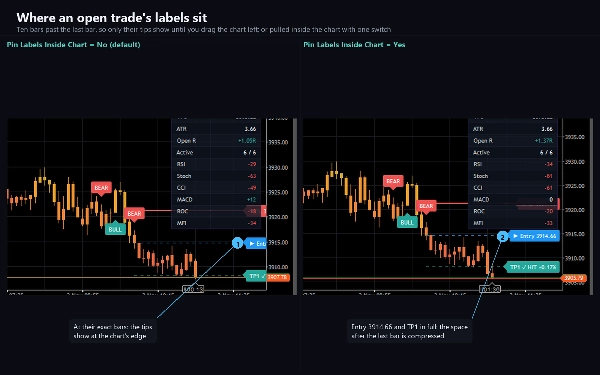
128 settings in twelve groups. Eight come first: core lengths and levels, the filters, the six components with their lengths and weights, trade tools, visuals, the dashboard, action words for the alert messages, and 24 colours. Four more belong to this platform: display, alerts, the webhook and diagnostics. One of them sets how much history it works through (20,000 bars by default). Another chooses where a trade's labels sit: at their exact bars ten bars past the last bar by default, or pulled inside the chart.
ALERTS AND WEBHOOK
Ten conditions, each with its own switch: BUY Signal, SELL Signal, Close Long, Close Short, Partial Close Long, Partial Close Short, SL Hit, TP1 Hit, TP2 Hit and TP3 Hit. An eleventh switch sends the indicator's own JSON trade messages, with six action words you choose. Each can arrive as a log line, a sound of your choice and e-mail, and a test on start checks your settings without waiting for a signal. Targets alert on the touch. Entries, the stop and a replaced trade alert at the close of the bar. Nothing fires while the indicator walks the chart's history, and nothing fires in a backtest.
A webhook posts the same eleven to any address you enter: a chat bot, a journal, an automation flow or your own server. Choose JSON, plain text or your own template with 26 placeholders. Add an access key header and one more header of your own. A post that gets no success answer is sent again, and a test on start checks the address. It stays off until you enter one, is capped at twenty messages a minute, and a failure is logged rather than thrown. It sends through cTrader's own networking service, which is why the indicator needs no file or network access rights at all.
TYPE AND WINDOW
An indicator in its own pane that also draws on the price chart: the candle colours, the markers, the trade levels and, by default, the dashboard. The dashboard can move to any corner or into the pane. It runs on standard candle charts; on Heikin Ashi, Renko and Range charts it shows a note instead, because those charts show synthetic prices.
TIMEFRAMES AND INSTRUMENTS
Any timeframe from one minute to daily and any instrument: forex pairs, metals, indices and crypto. Every component is scaled by its own rules and the levels by the symbol's own ATR, so the same settings fit each market. When it attaches, the indicator loads the history it needs, up to the history setting.
USE CASES
- Reading six oscillators as one line, with their individual scores one glance away.
- Waiting for a momentum cross that most of the components support, instead of acting on any single one.
- Keeping signals with a higher timeframe, or out of directionless phases, with the two optional filters.
- Planning a trade from levels sized by the symbol's own volatility.
- Being told by log line, sound, e-mail or webhook when a signal fires, a target is touched or a trade closes.
WHO IT IS FOR
Traders who use oscillators and want them combined by fixed rules, with the reason for every signal in view.
TECHNICAL NOTES AND LIMITATIONS
Access rights: none. The indicator cannot read files, start processes or open connections of its own.
It is a charting and analysis tool. It does not place orders and it has no access to your account.
MFI reads your broker's tick volume, and every component reads your broker's candles, so another feed can give a slightly different score. A symbol with no volume runs on the other five components. The markers and the trade state depend on where history starts, so a different history setting can change the earliest signals. On the bar that is still forming, the score and the dashboard move with every tick; markers and the stop wait for the close.
SUPPORT
Questions go through the Discussion tab. Include your broker, symbol, timeframe, cTrader version and a picture of the full chart, and you will get a useful answer first time.
Trading involves risk. Past performance does not guarantee future results.