Indicator
RSI
EURUSD
MACD
Supply&Demand
"Supply&Demand" logo
03/09/2025
1
Desktop
Since 22/11/2024
Traded volume
5.05M
Pips won
121.23K
Sales
68
Free installs
1905
"Supply&Demand" uploaded image"Supply&Demand" uploaded image"Supply&Demand" uploaded image

⚡ Key Features

  • Dynamic Zone Detection
    • Auto‑detects swing highs/lows and draws supply (resistance) & demand (support) zones in real time.
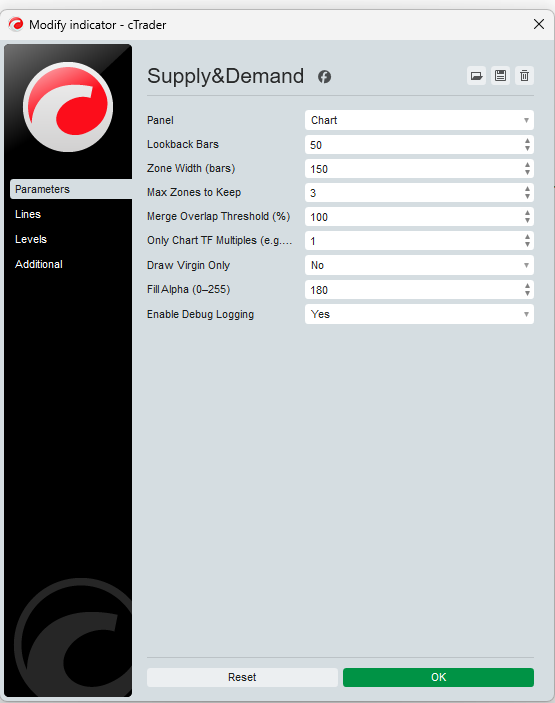
    • Configurable lookback & zone‑width parameters let you adapt sensitivity for any market or timeframe.
  • Virgin‑Zone Highlighting
    • Fresh “virgin” zones (never‑touched by price) are visually emphasized—trade where institutions left orders.
    • Optionally hide touched zones to keep your chart uncluttered.
  • Multi‑Timeframe Filtering
    • Plot only zones that align with your chart’s timeframe multiple (e.g. show daily zones on your 1‑hour chart).
    • Quickly see the confluence of higher‑TF supply/demand with your intraday setup.
  • Non‑Repainting & Non‑Lagging
    • Zones are fixed once drawn—no disappearing or shifting lines after price moves.
    • Back‑tested reliability: zones remain static, giving you confidence in historical analysis.
  • Custom Alerts & Logging
    • Get pop‑up or email alerts when price enters or breaks a zone.
    • Detailed debug log shows zone creation, overlaps skipped, and zone touches.
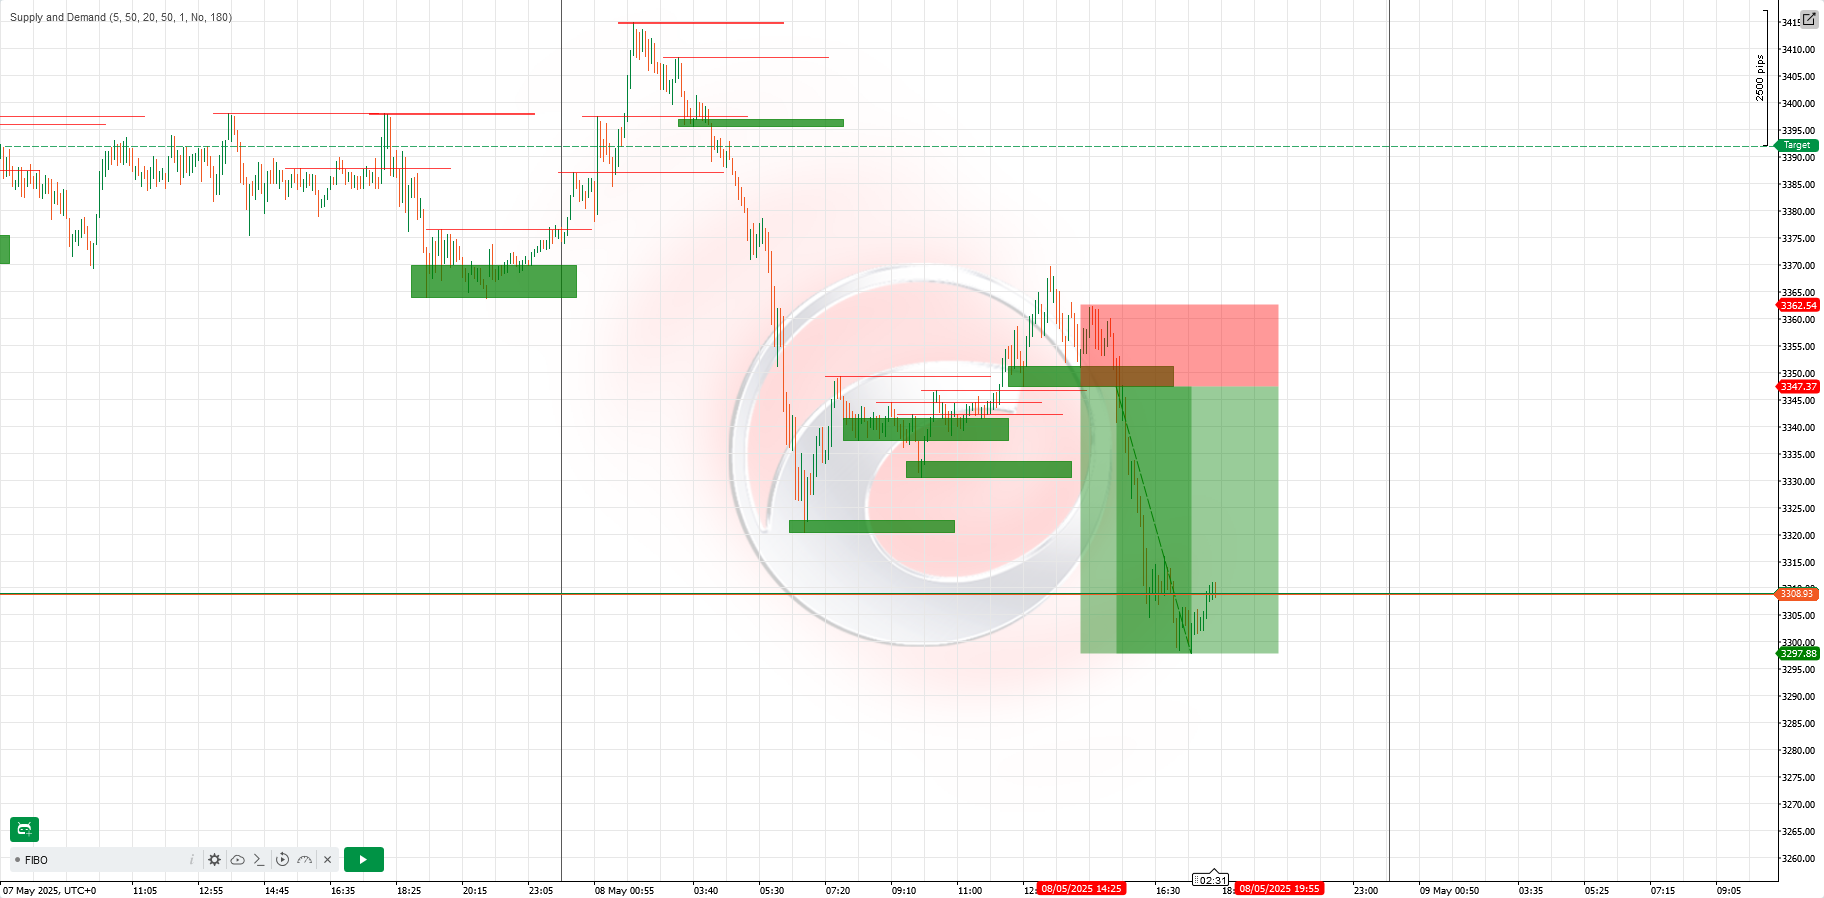
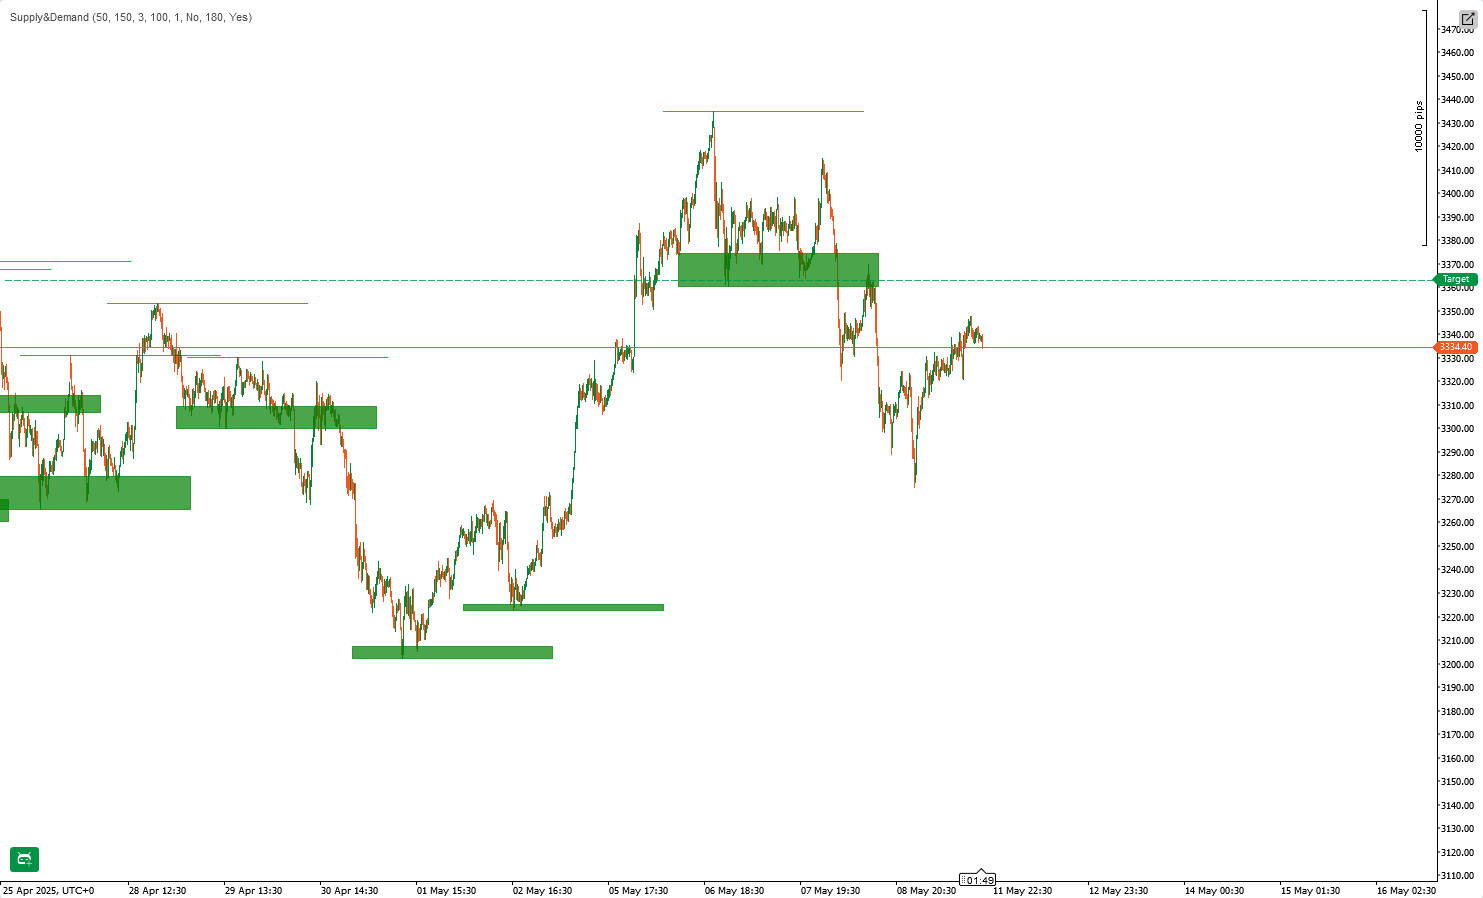

🚀 How It Works

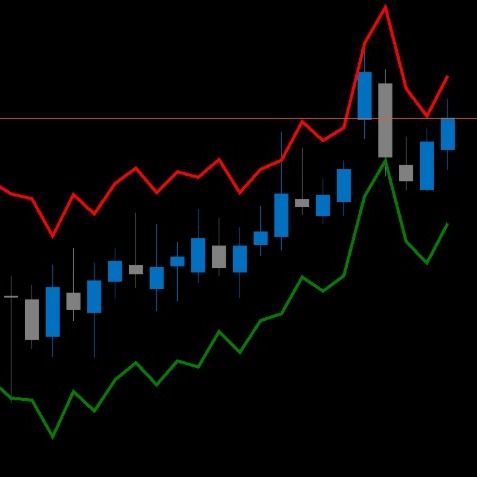
  1. Pivot Detection: The indicator scans each new bar for pivot highs (supply) and pivot lows (demand) based on your chosen lookback.
  2. Zone Construction: For each pivot, a rectangular zone is drawn extending forward—highlighting where institutions likely placed limit orders.
  3. Overlap Filtering: Zones overlapping beyond your threshold merge or skip, ensuring only the most significant areas remain.
  4. Virgin‑Only Option: Keep only untouched zones visible to focus on the freshest institutional levels.


🎯 Example Trading Strategies

StrategyTimeframeEntryStop‑LossTake‑Profit

Zone Rejection

H1

Wait for price to rally into a demand zone and show a bearish candlestick (engulfing/pin bar) in supply zone

Just beyond zone boundary

1.5× zone height

TF Confluence

M15 + H4

Identify H4 demand zone, then switch to M15 for bullish momentum candle inside that zone

Below H4 zone low

Next H4 swing high

Break & Retest

H4

After price breaks a supply zone, wait for retest of zone underside and bearish confirmation

Above zone top

Recent H4 low

Usage Tip: Combine with RSI or MACD divergence inside zones for higher‑probability signals.


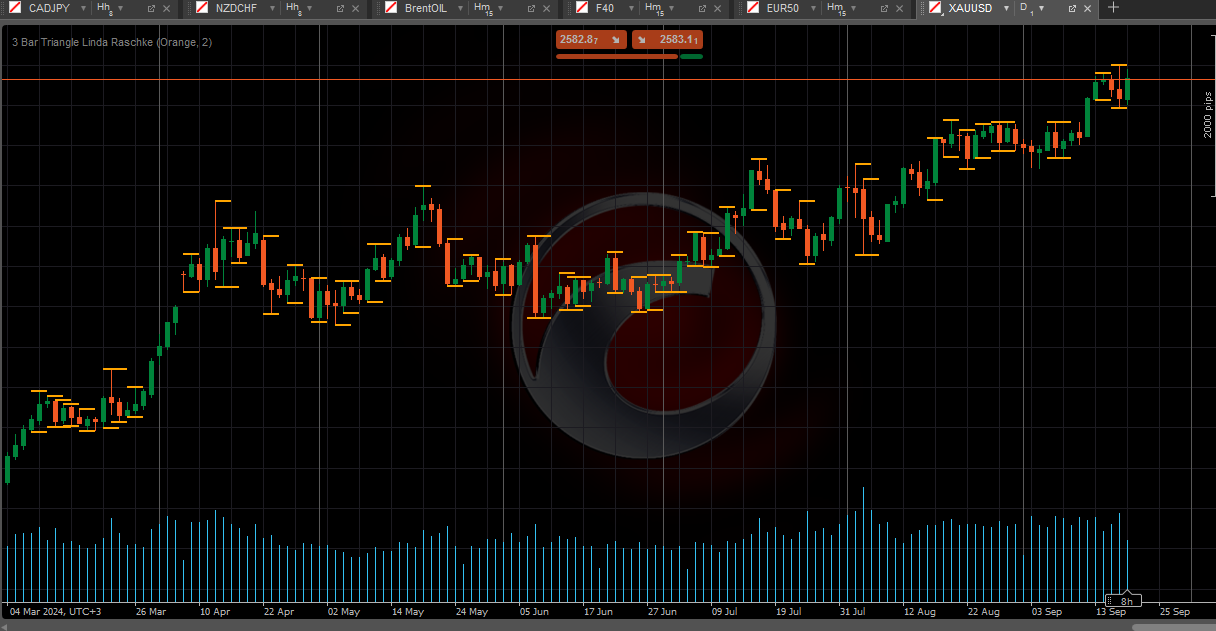
📈 Real‑World Example

  1. On EURUSD H4, the indicator draws a demand zone at 1.0950–1.0980.
  2. Price dips into zone, prints an M15 bullish engulfing candle.
  3. Entry at 1.0970, stop at 1.0945 (below zone), target at 1.1040 (next H4 resistance).
  4. Result: +70 pips (~6.4× risk).


⚠️ Disclaimer

This indicator is a tool—not a guaranteed profit system. Past performance does not ensure future results. Always use proper risk management (e.g. max 2% per trade), test on a demo account first, and combine with your own analysis. Trading carries risk of loss; only trade with capital you can afford to lose.

More from this author
Indicator
Indices
RSI
Stocks
+3
Advanced RSI Indicator
Advanced RSI Indicator with multi-MA smoothing, Bollinger Bands, divergence detection, and fill zones for cTrader.
Indicator
Stocks
Commodities
Forex
+1
Support & Resistance Pro
The Support & Resistance Pro helps traders identify key support and resistance levels for informed trading decisions.
FibonacciStrategyCBot
FiboSmart cBot automates Fibonacci-based trading with trend, RSI, and MACD filters, plus built-in money management, trai
Indicator
RSI
MACD
Multi-Timeframe Market Levels
Unlock market insights with our Multi-Timeframe Market Levels indicator, enhancing your trading strategies effortlessly
Indicator
ATR
Stocks
Commodities
+2
LevelMaster SR
LevelMaster S/R: Pinpoint key support & resistance zones with precision. Perfect for traders of all levels Trade smarter
Indicator
Indices
Stocks
Forex
+4
MACD Pro Trader
🚀 MACD Pro Trader – Advanced MACD with buy/sell signals, custom MAs & color-coded histograms for smarter trading! 📈🔥
Indicator
Signal
MACD
TradingViewMACD
Enhance your trading strategy with our customizable TradingViewMACD indicator. Optimize and elevate your market analysis
Indicator
VWAP
Indices
RSI
+4
ProVWAP
Advanced Anchored VWAP for cTrader: volatility bands, real‑time alerts & customizable session resets.
Indicator
Breakout
AutoLines™ Support & Resistance
FlexSR auto‑detects pivot highs/lows to plot dynamic support & resistance lines Features customizable styling and option
Indicator
RSI
Breakout
XAUUSD
+1
ZigzagSR
Automatic ZigZag swings with dynamic support & resistance levels, labeling highs/lows for clear trend signals.
SmartFibonacci
SmartFibonacci — automatic Fibonacci retracements & extensions with swing detection, alerts and clean labels for cTrader
Indicator
NAS100
NZDUSD
Martingale
+26
ICT Killzones
ICT Killzones plots Asian, London & New York trading sessions on your cTrader charts with clear zones & labels.
Indicator
Breakout
Stocks
Commodities
+1
Advanced Donchian Zones
MTF Donchian: Identify trend breakouts & key zones with precision. Perfect for swing & day traders seeking accuracy!
You may also like
CandleCounterAlex
CandleCounterAlex – Candle Cycle Counter with Colors and Adjustable Position.
Indicator
Stocks
Forex
Crypto
+1
Market Structure SNR + Auto Bias
Market Structure Indicator – Your Trading Map in a Noisy Market. No more Panicking Which one, Where, Why and How.
Indicator
Forex
Signal
MACD
swingh6
Swing-Trading Indicaotr for pairs like EUR/USD, AUD/USD, and USD/JPY. Most effective on higher time frames H4,H6,H12...
Indicator
Indices
RSI
Stocks
+3
Advanced RSI Indicator
Advanced RSI Indicator with multi-MA smoothing, Bollinger Bands, divergence detection, and fill zones for cTrader.
Indicator
NAS100
NZDUSD
XAUUSD
+10
Atlas Seasonal Returns Heatmap
🧭 See when your market tends to move—by Month, Day-of-Week, or Hour-of-Day🧭
Indicator
NAS100
NZDUSD
XAUUSD
+13
MACD Histogram PRO
Enhance MACD Histogram! Visualize bull and bear price changes with vibrant colors for clearer, more insightful trading.
Weis & Wyckoff System v2.0
Indicator
RSI
MACD
SmartBot-MACD & RSI Indicator
This indicator is a combination of MACD and RSI into one. This is perfect fusion and powerful indicator ever.
VolumeProfile_8
Scalpers Volume Profile
LaguerreRSI
Laguerre RSI: smoother, faster RSI with less noise. Great for spotting reversals and timing entries.
Indicator
Indices
Breakout
Supertrend
[CB] Pivot Points Pro
You can use the cTrader Pivot Points Pro indicator to find a good pullback entry in a trend
[Hamster-Coder] Pivot Points (Demo)
[Hamster-Coder] Pivot Points (Demo)
[Hamster-Coder] Moving Average
Universal Moving Average indicator with extended features
Indicator
Indices
XAUUSD
Commodities
+8
ATR on Chart
Plots the ATR on the chart for easy visualization.
Indicator
Signal
MACD
USDJPY
PulseTracker
Version 1.2: Advanced Trend Detection & Visualization System
Indicator
Breakout
3 Bar Triangle by Linda Raschke
3 bar triangle = high below 2 day high, low above 2 day low
Indicator
Signal
dark-cloud
The Dark Cloud Cover indicator detects a bearish reversal pattern, marking key candles and confirming signals based on v
SmartLiquidityZonesPRO
Smart Liquidity Zones PRO auto-detects liquidity grabs, wicks, traps & manipulations — trade like the smart money.