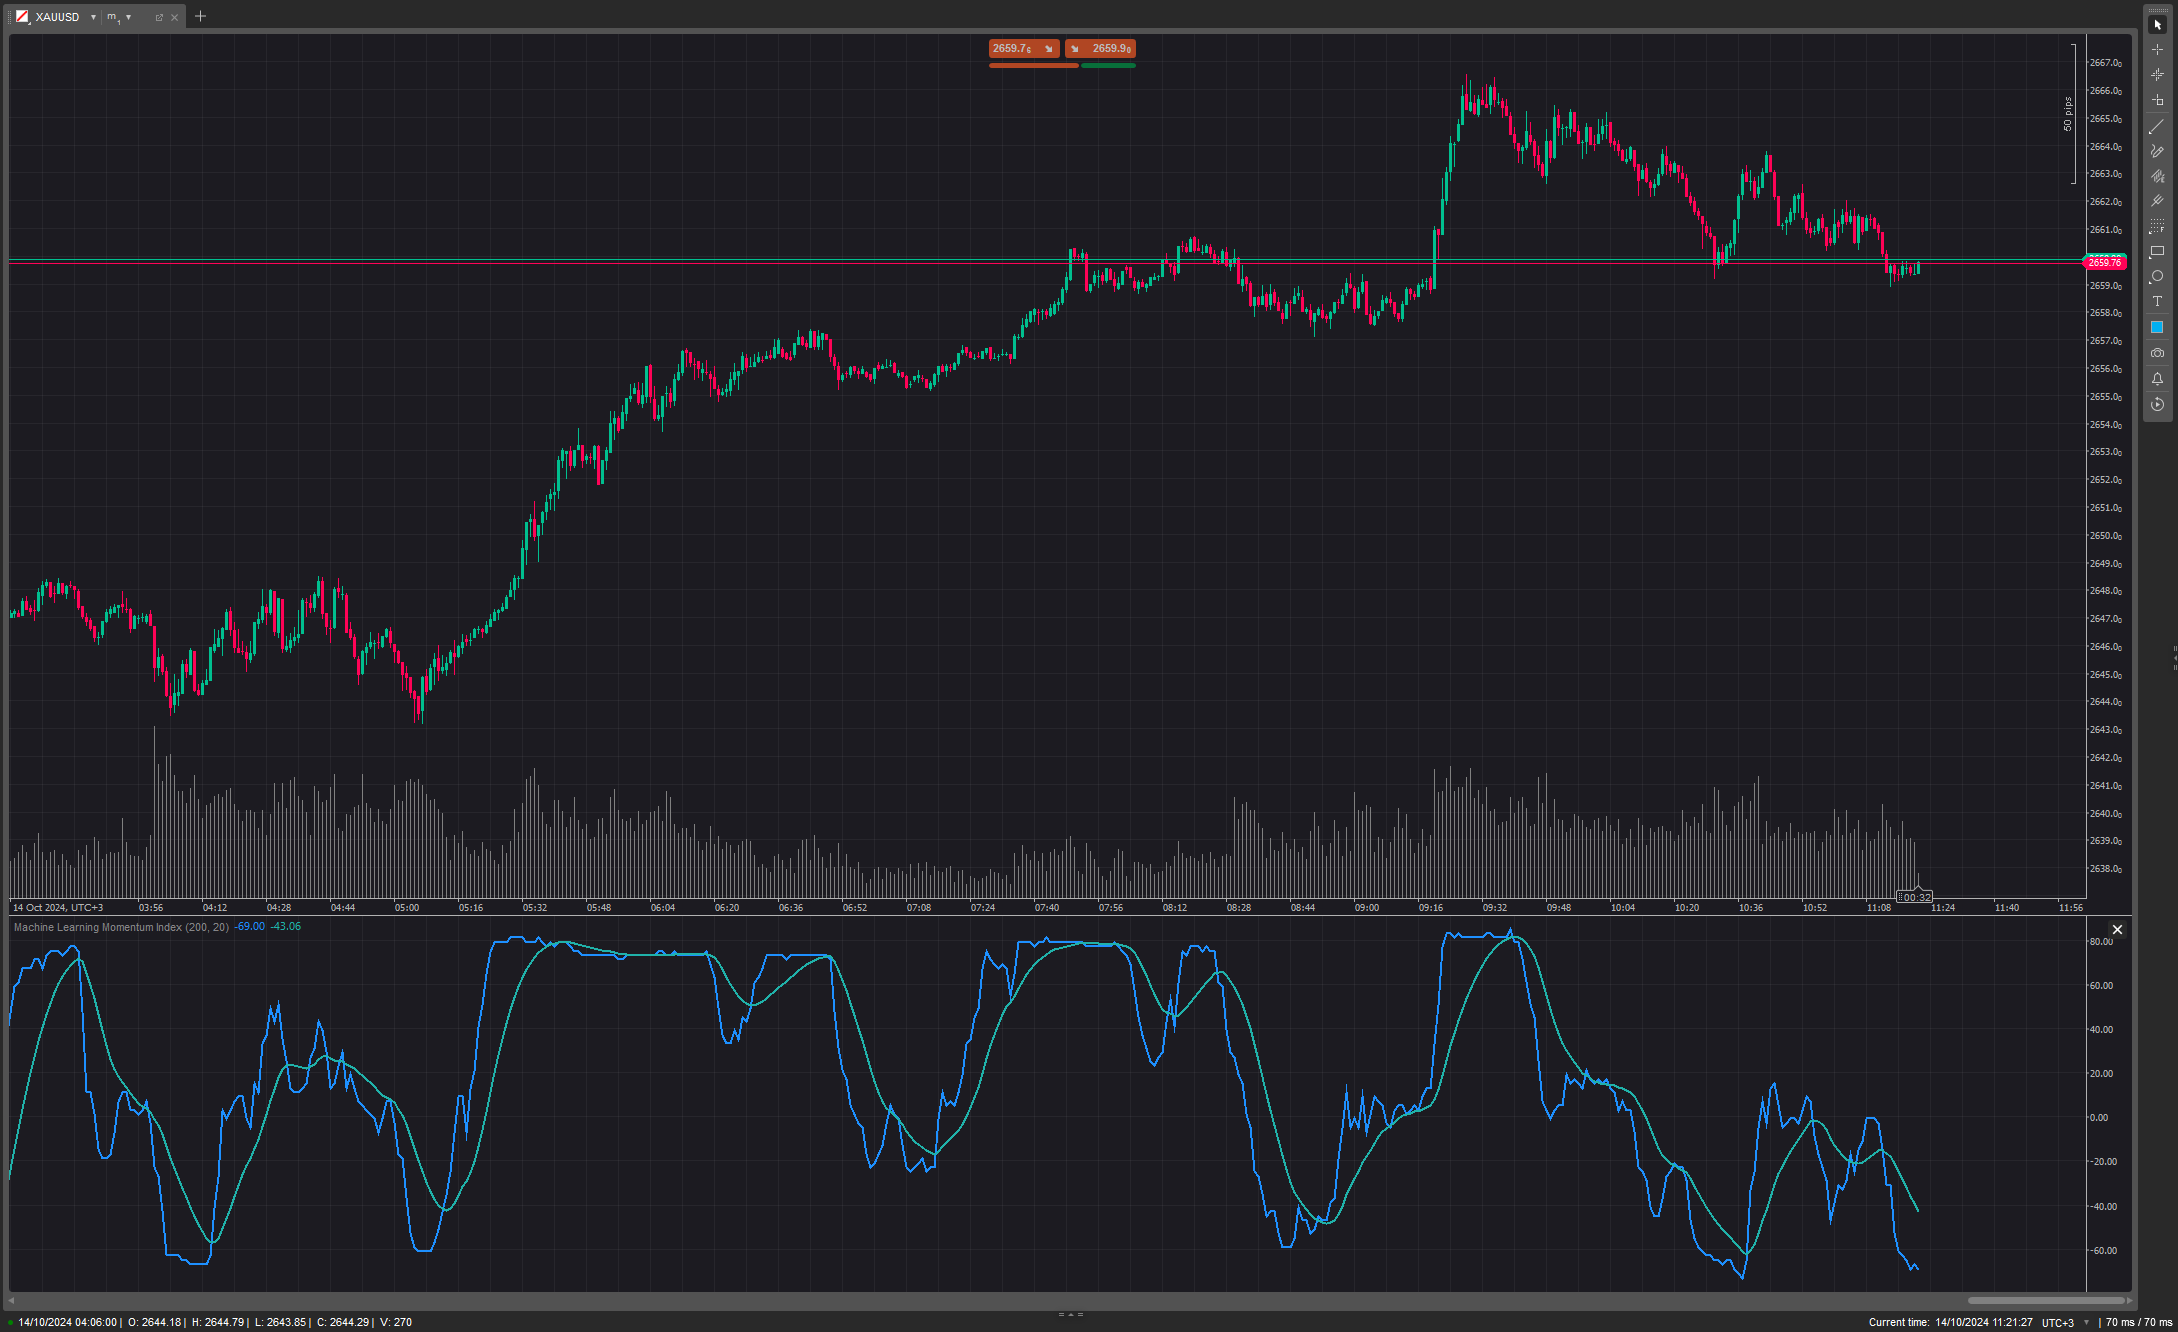
Machine Learning Momentum Index
4.5
03/09/2025
823
Desktop
The Machine Learning Momentum Index (MLMI) represents the next step in oscillator trading. By blending traditional momentum analysis with machine learning, MLMI delivers a potent and dynamic tool that aligns with the complexities of modern financial landscapes. Offering traders an adaptive way to understand and act on market momentum and trends, this oscillator provides real-time insights into market momentum and prevailing trends
More from this author


You may also like
.jpg)


.jpg)