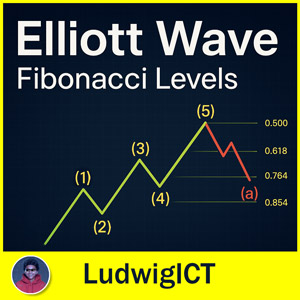
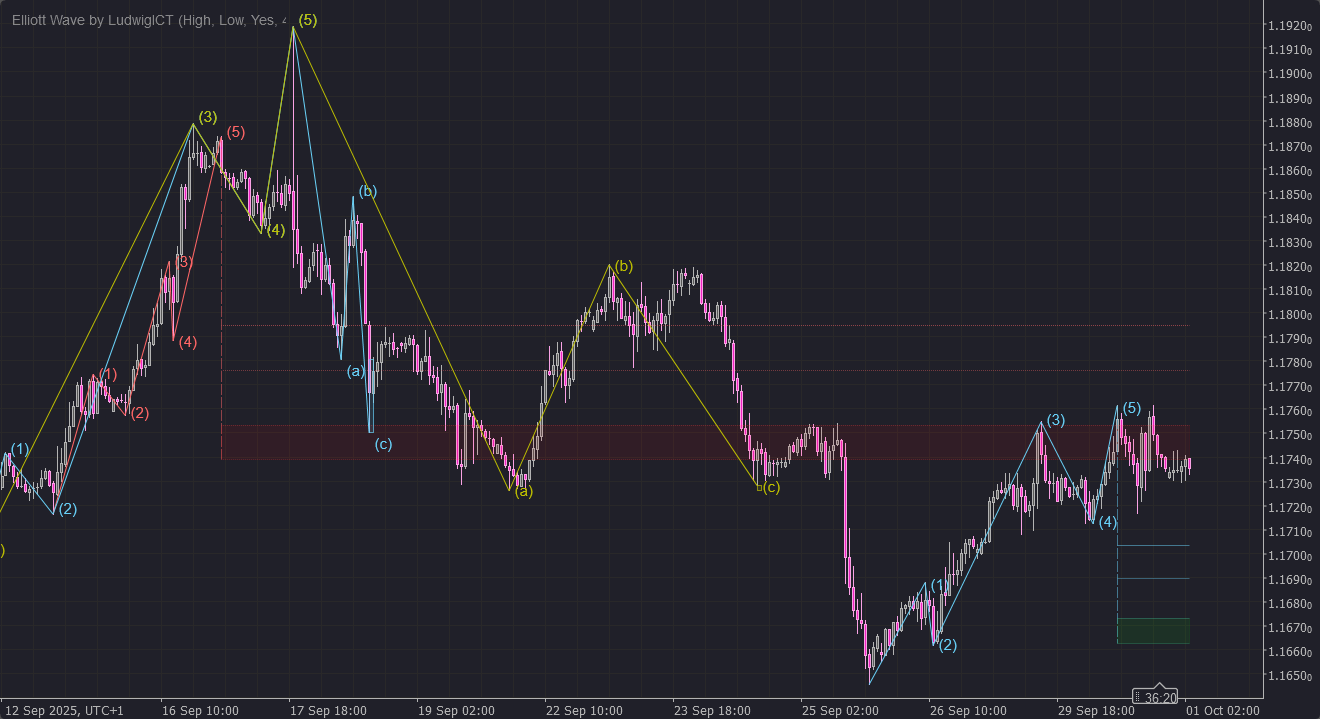
Indicator
NAS100
NZDUSD
Breakout
XAUUSD
Commodities
Forex
Fibonacci
Signal
EURUSD
GBPUSD
BTCUSD
ZigZag
Indices
ATR
Stocks
Crypto
USDJPY
Elliott Wave Fib Auto
"Elliott Wave Fib Auto" logo
01/10/2025
Desktop
SinceΒ 16/03/2025
Traded volume
17.81M
Pips won
59.92K
Sales
23
Free installs
431
"Elliott Wave Fib Auto" uploaded image"Elliott Wave Fib Auto" uploaded image

πŸ“ˆ Elliott Wave – Fibonacci Levels [LudwigICT]

πŸ”₯ Unlock the full power of Elliott Wave Theory combined with dynamic Fibonacci retracements – all automated for you inside cTrader!

This indicator brings professional-grade wave counting and precise Fibonacci zones directly to your charts, making trend forecasting and trade execution easier than ever.


✨ Key Features

πŸ”Ή Automatic Wave Detection

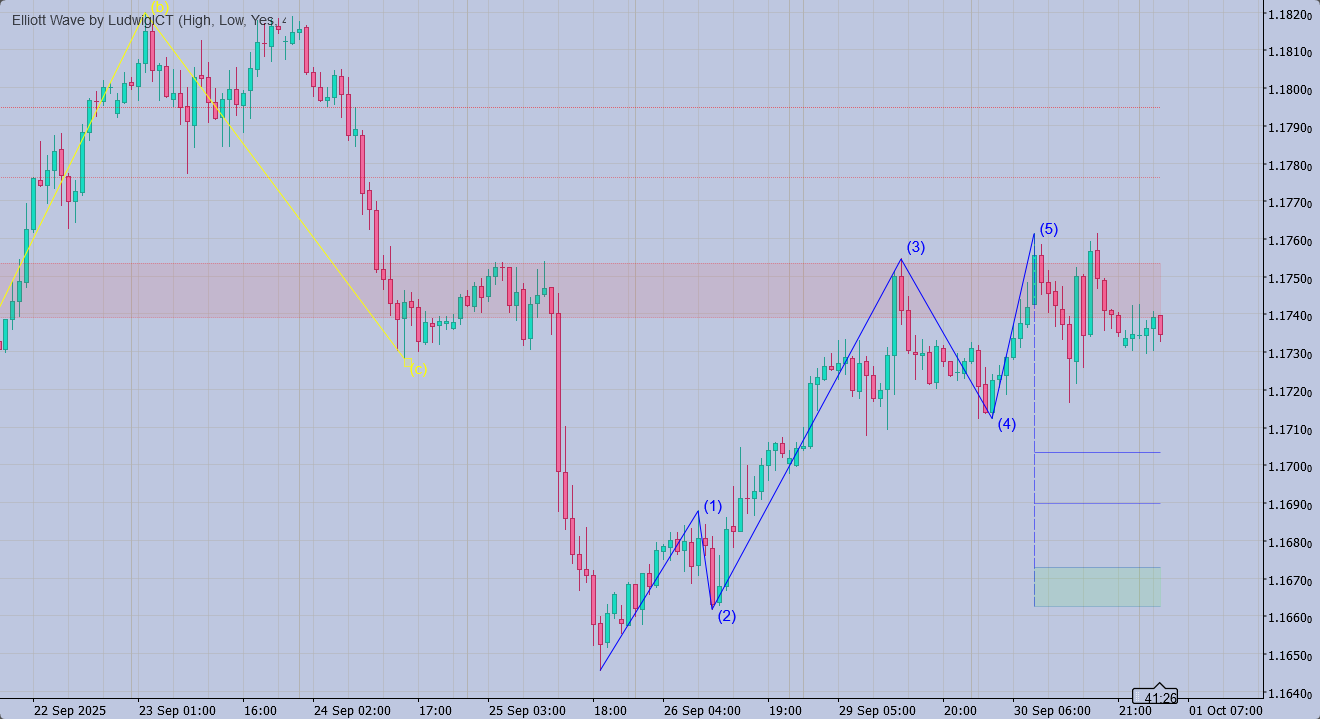
  • Identifies 5-wave motive structures (1–5).
  • Detects 3-wave corrective patterns (A–B–C) immediately after motive completion.
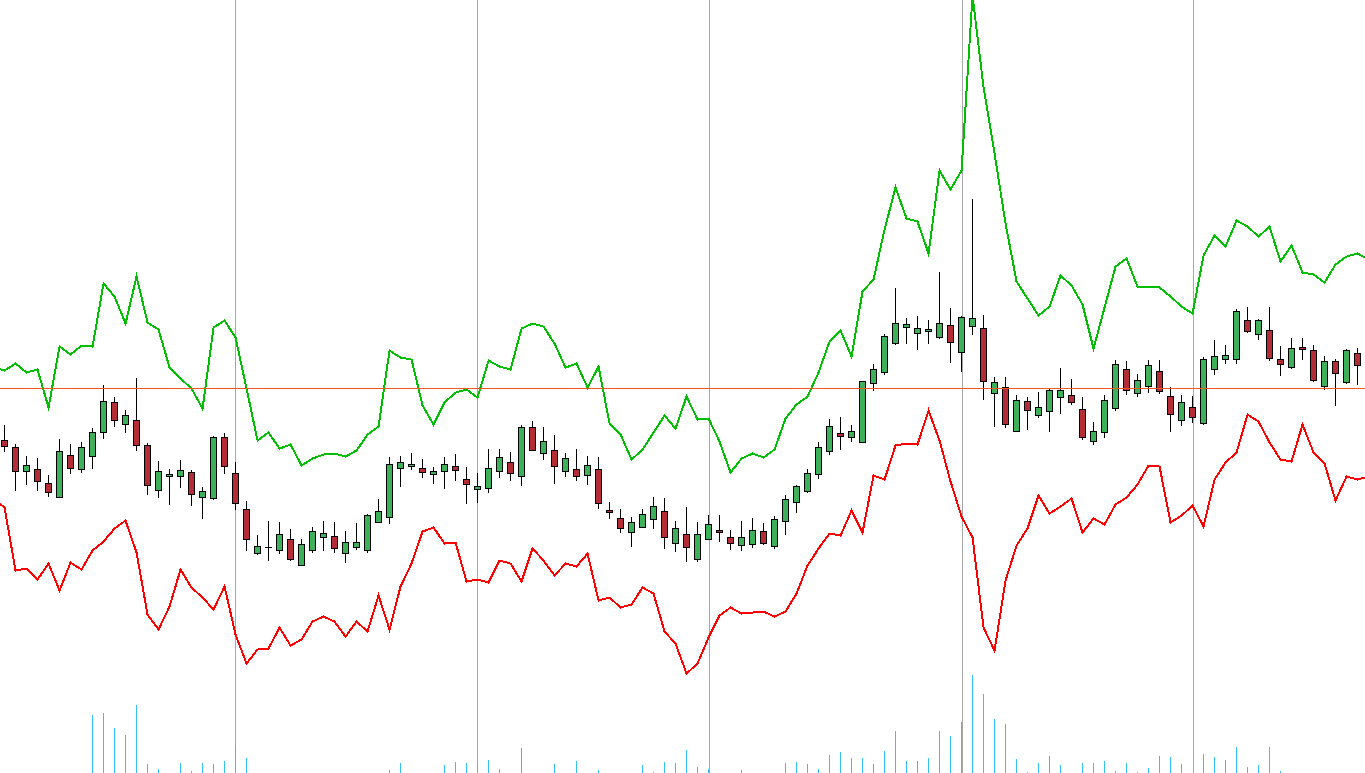
πŸ”Ή Dynamic Fibonacci Retracements

  • Auto-plots key retracement zones: 0.500 β€’ 0.618 β€’ 0.764 β€’ 0.854.
  • Updates in real time with wave development.
  • Highlights invalidations with dotted lines.

πŸ”Ή Multi-ZigZag Framework

  • Runs three independent ZigZag calculations with customizable length & colors.
  • Ensures flexible sensitivity for different market conditions.
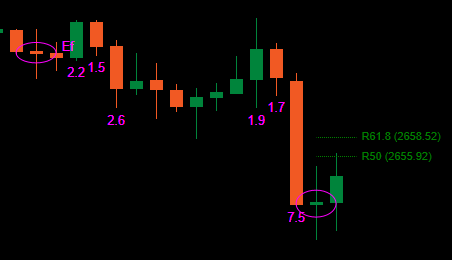
πŸ”Ή Professional Visuals

  • Clean wave labels (1)…(5) and (a)(b)(c) placed with ATR-based smart offsets.
  • Breakout boxes with bold X markers when levels are breached.
  • Gradient-like Fibonacci fill areas for easy spotting.
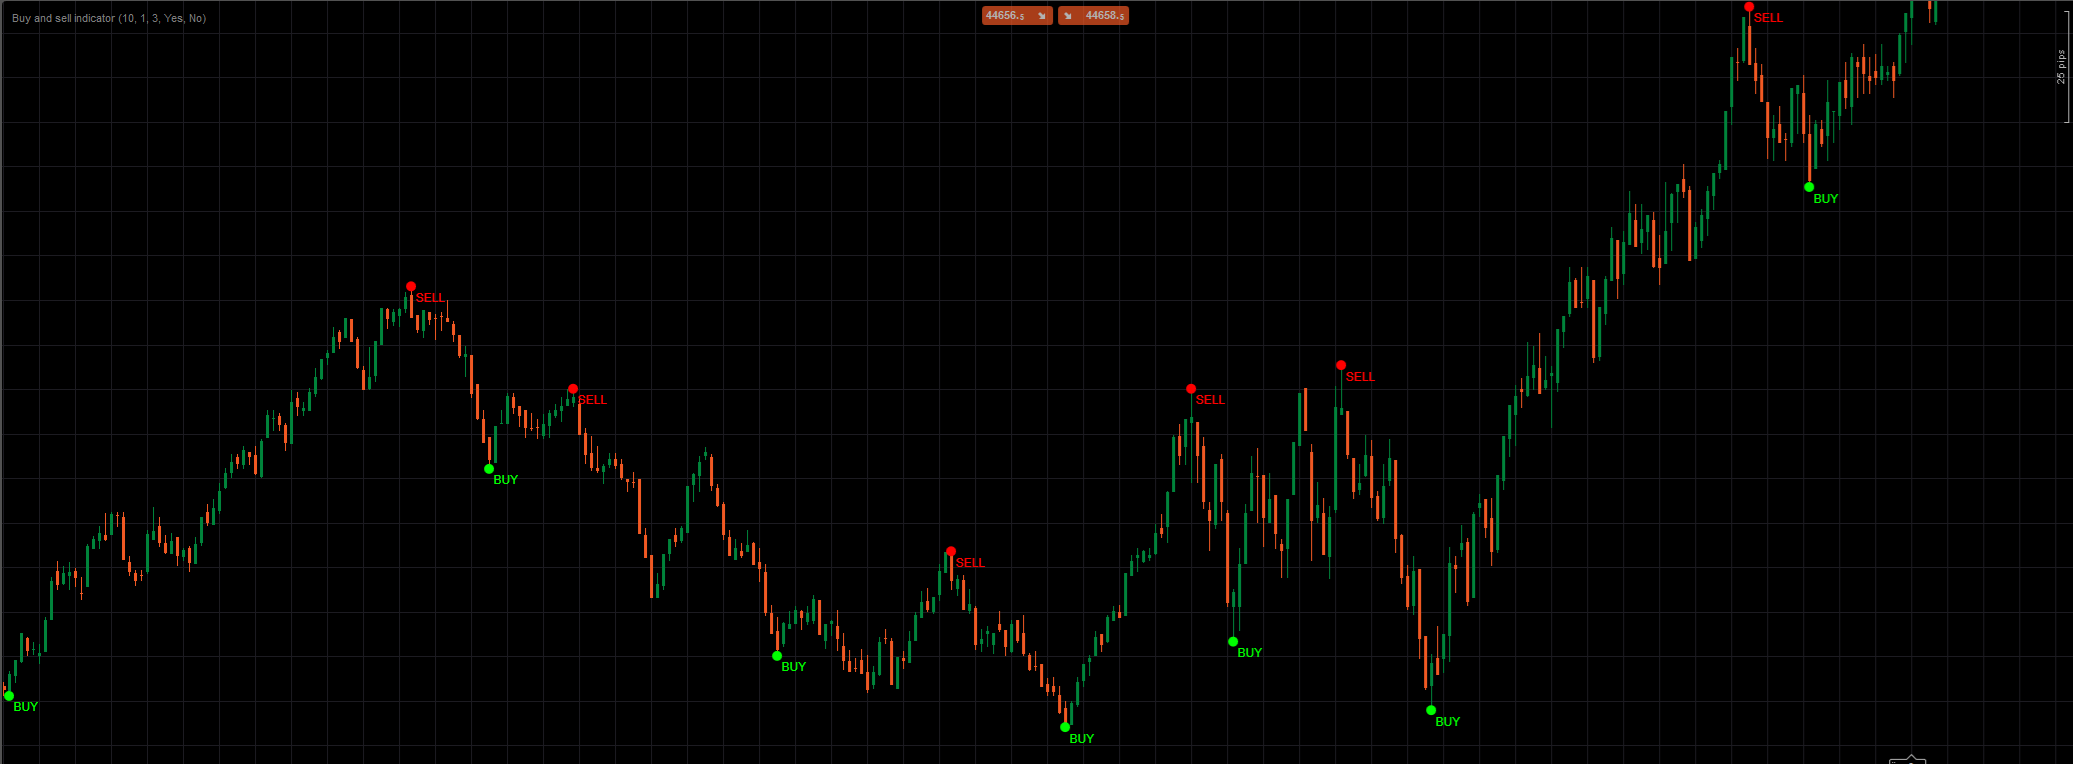
πŸ”Ή Trade Assistance

  • Automatic identification of a possible new Wave (1) after A–B–C correction.
  • Audio alerts for new waves, invalidations, and breakout signals.


πŸ›  How to Use

  1. Apply to Chart
    • Simply drag & drop Elliott Wave – Fibonacci Levels [LudwigICT] onto your cTrader chart.
    • Works on all timeframes (scalp, swing, long-term).
  2. Customize Parameters
    • 🎨 Adjust ZigZag lengths & colors.
    • πŸ“ Tune Fibonacci levels (default: 0.500, 0.618, 0.764, 0.854).
    • βš™οΈ Modify label offsets and breakout box settings.
  3. Read the Waves
    • βœ… Waves (1–5) = Motive wave (trend direction).
    • πŸ”„ Waves (a–b–c) = Corrective wave (countertrend).
    • πŸ“Š Fibonacci levels show likely retracement zones for entries/exits.
  4. Trade with Confidence
    • Enter trades around Fibonacci retracements after a completed motive wave.
    • Manage risk when levels are broken (indicator alerts you automatically).
    • Look for the Next Wave (1) icon to anticipate new trend cycles.


🎯 Why Choose This Indicator?

βœ… Saves hours of manual wave counting.
βœ… Avoids subjective mistakes in Elliott Wave analysis.
βœ… Clean, precise, professional visuals directly on your chart.
βœ… Created & optimized by LudwigICT, trusted in trading automation.


πŸ–₯ Compatibility

  • Platform: cTrader Desktop v5+
  • Instruments: Works on Forex, Stocks, Indices, Commodities, Crypto.
  • Timeframes: From 1m scalping to weekly swing analysis.


⚑️ Get Started Now

πŸš€ Add Elliott Wave – Fibonacci Levels [LudwigICT] to your trading arsenal today and take your chart analysis to the next level!

πŸ‘‰ Perfect for traders who rely on price action, structure, and Fibonacci retracements to time their entries and exits with precision.

More from this author
VALID Hi and Lo
ICT Valid High & Low Detector – Multi-Pair, Multi-Timeframe
Order Block detector PRO
Order Block PRO β€” Smart Institutional Zone Detector
AlphaTrend Pro by LudwigICT
Indicator
XAUUSD
Commodities
Forex
+3
Silver Bullet by LudwigICT
Indicator
Indices
XAUUSD
Prop
+8
FREE Squeeze Momentum from TradingView
Squeeze Momentum - Anticipate explosive market moves before they happen
Indicator
Indices
Commodities
Forex
+2
Advanced Swings
ICT Advanced Swings Indicator – Multi-Timeframe Precision
cBot
XAUUSD
Commodities
Forex
+3
Volatility Sniper Breakout BETA
Volatility Sniper Breakout Bot (Beta) – Intelligent Breakout Trading for Volatile Markets
cBot
Scalping
FRAMEWORK
ICT Framework cBot – Advanced Trading Automation for Any Pair & Timeframe
Indicator
Grid
RSI
Breakout
+18
Logarithmic Framework by LudwigICT
Indicator
Grid
NAS100
RSI
+16
Smart Money Breakout Channels
Smart Money Breakout Channels by LudwigICT β€” cTrader/cAlgo Indicator
DIGITAL IMPLEMENTATION SYSTEM
LudwigICT – Digital Root & IDR (cTrader Automate)
Indicator
NAS100
NZDUSD
XAUUSD
+14
Volume Profile Pivot Anchored
Anchor volume profiles to pivots with POC, VAH, VAL and real-time insights for clearer trade decisions.
ADVANCED ICT + ADR + AWR SUITE PRO
ADVANCED ICT + ADR + AWR SUITE PRO (The Ultimate All-in-One Toolkit for Price Action Traders)
Indicator
VWAP
RSI
XAUUSD
+9
Turtle Soup ICT Strategy
Turtle Soup ICT Strategy – Smart Liquidity Trap Detection for cTrader
MMXM Structure by Ludwig
MMXM Structure by LudwigICT – Professional Market Structure Mapping Tool
True Deviation System
True Deviation System – Precision Meets Professional Trading
Indicator
XAUUSD
Forex
EURUSD
+2
ALMA Smoothed Gaussian Moving Average
ALMA Smoothed Gaussian Moving Average (ASGMA) – by LudwigICT
Indicator
VWAP
XAUUSD
Forex
+2
Dynamic Swing Anchored VWAP
You may also like
Indicatore utbot
L'indicatore UTBot Γ¨ uno strumento di analisi tecnica che crea una linea di trailing stop dinamica basata sull'ATRT
Indicator
XAUUSD
Commodities
ATR
+1
[Stellar Strategies] Visual Trend Momentum
Visual Trend Momentum is a MA/ATR/Volume trend tool. Visual signals for strong trends & reversals. Customizable. πŸ“ˆπŸ“‰
SmartBot-Tenkan & ATR Indicator
The Tenkan-ATR Indicator is a powerful and innovative indicator for Traders. SALE OFF!!!
Market Entropy
Market entropy + DC. Spot crystallization/chaos shifts with an optional on-chart overlay.
Indicator
NAS100
NZDUSD
Breakout
+12
RT ATR Bands
Enhance trading with ATR Bands! Visualize market volatility using dynamic upper and lower ATR bands for precise decision
TDI_Pro
Traders Dynamic Index (TDI) β€” Divergence Edition
Buy and sell indicator
Buy and Sell Signals
Volume-Powered Market Flow Projector
Project market behavior by integrating price and volume data across multiple time dimensions
Indicator
RSI
Signal
MACD
[Stellar Strategies] Moving Averages Combined 1.0
Smooths price action with 6 MAs (3 SMA, 3 EMA). Reduces noise, clarifies trends πŸ“ˆπŸ“‰
LT_Ind_Candles
Most used candle patterns. (1 candle, 2 candles and 3 candles patterns) and Marubozu. Bonus Fibo Risk control.
Indicator
RSI
Breakout
Supertrend
TrendMaster Pro MultiMA
Connects each moving average value from candle to candle, forming a fan-like structure of trendlines.
Indicator
Indices
RSI
Signal
+1
[Stellar Strategies] QQE
The QQE indicator is a technical analysis tool designed to identify potential trend changes and trading signals πŸ“ˆπŸ“‰
VegaXLR - Fibonacci Alerts
Alerts you when price touches Fibonacci levels. Stay organized and trade efficiently!
Top-rated
Free
BarSentiments
This Indicator is a technical analysis tool that measures the strength and direction of market sentiment
Indicator
Indices
RSI
Bollinger
Clustering
Clustering tool for traders with visual insights into market patterns.
Indicator
RSI
Breakout
XAUUSD
+6
Fair Value Gap Sessions
identify and highlight temporary market inefficiencies known as "fair value gaps" 🚨 within specific trading Sessions.
Indicator
XAUUSD
Commodities
Forex
+10
CosmicDecisionSystemPro
Decision System Indicator According to Cosmic Laws
Renko Moving Average Cross Indicator
The Renko Moving Average Cross indicator combines classic EMA crossover signals with Renko-filtered prices.