IRiskRewardTools
"IRiskRewardTools" logo
17/09/2025
1
Desktop
Since 30/09/2024
Sales
34

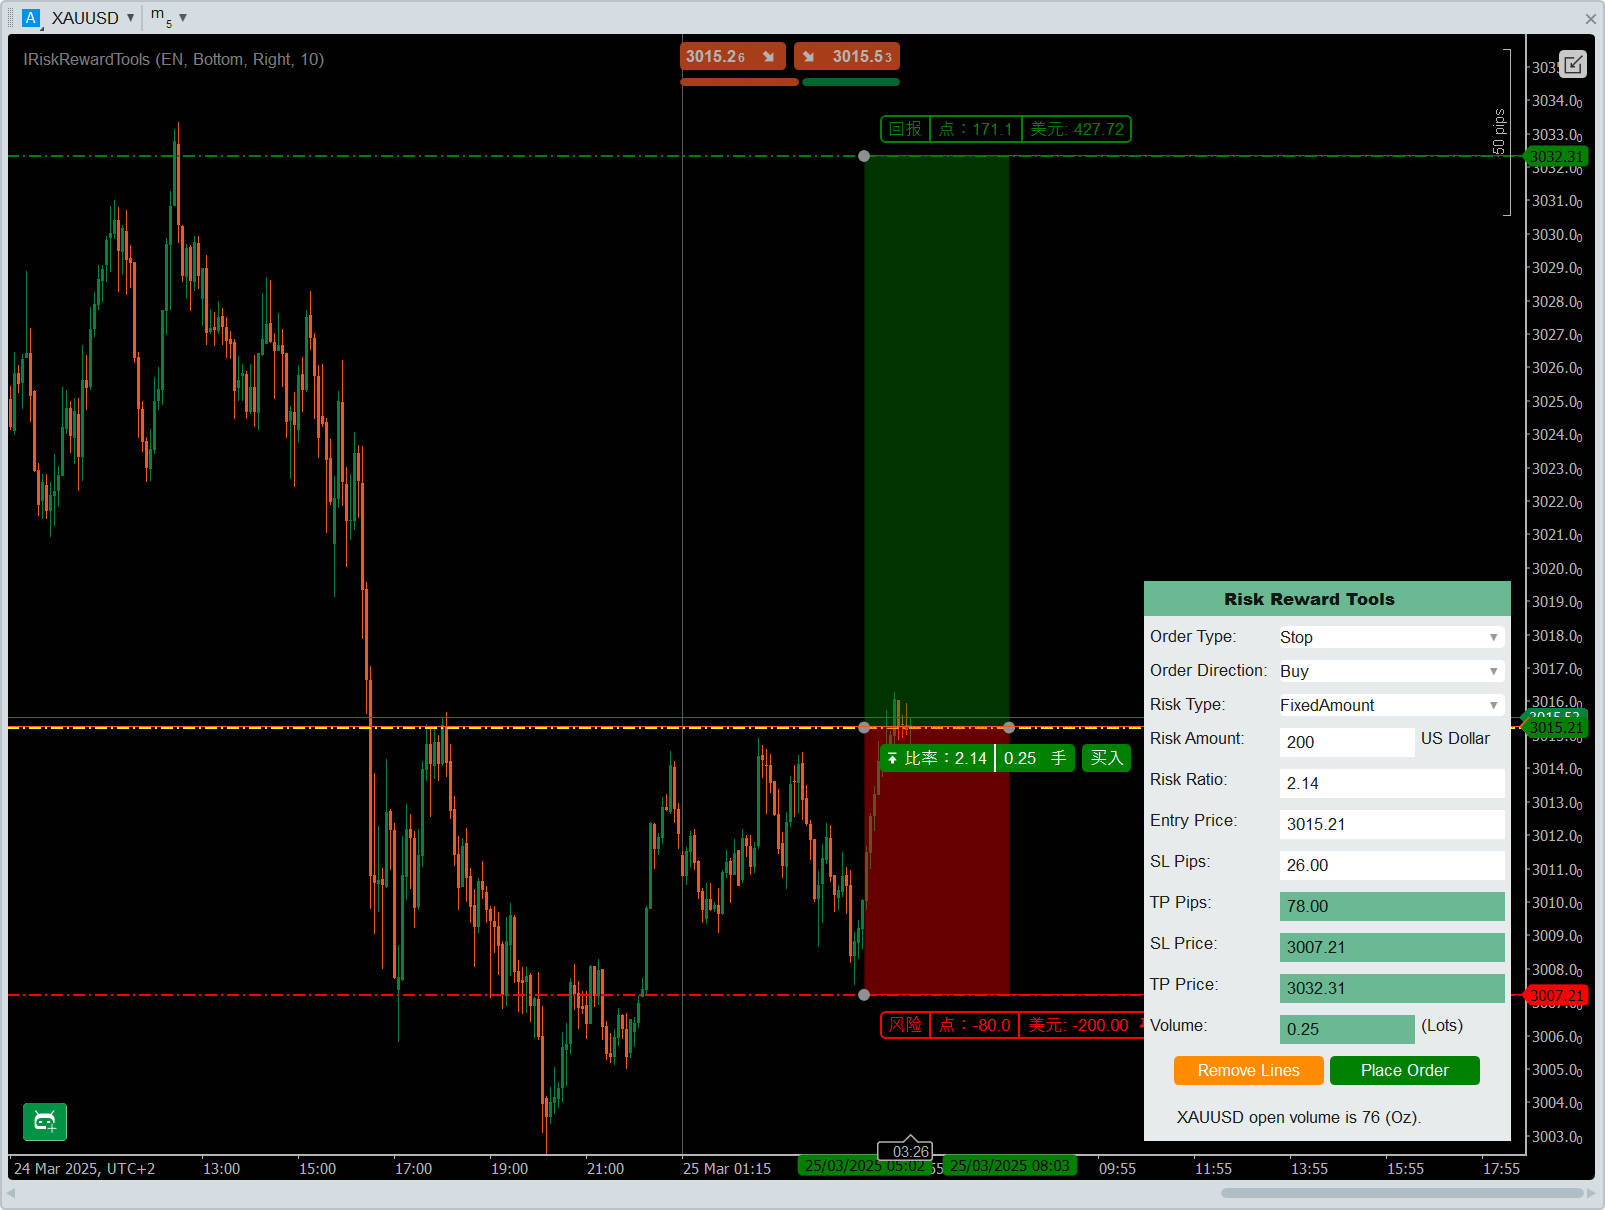
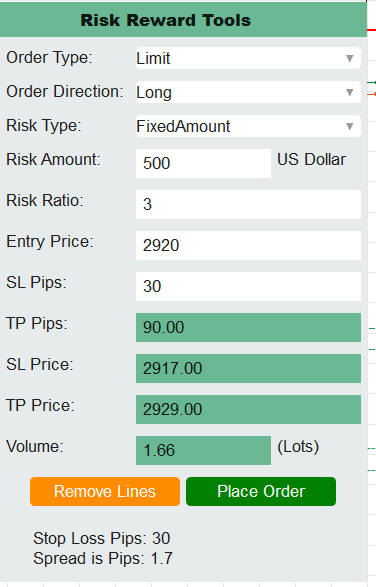
This indicator is a risk management tools. The details are as follows:

1) Order Type: Limit Order, Market Order, Stop Order;

2) Risk Method: Fixed Amount (for example, $200, user can input), Percentage of Account Balance (for example, 1%, user can input);

3) Risk-Reward Ratio: User can input this value, for example triple profits. The system automatically calculates the tradable lot size, entry price, stop-loss pips and price, and take-profit pips and price based on the set values;

4) Entry Price: Defaults to the current price of the current instrument, user can modify and input manually;

5) Stop Loss Pips: Defaults to the 10 * symbol spread (user can modify and input manually);

6) Lot Size: Automatically calculated;

7) Take Profit: Automatically calculated (including pips and price);

8) Stop Loss Price: Automatically calculated.

At the bottom of the interface are "Place Order" buttons to execute order placement operations based on the above parameter settings.


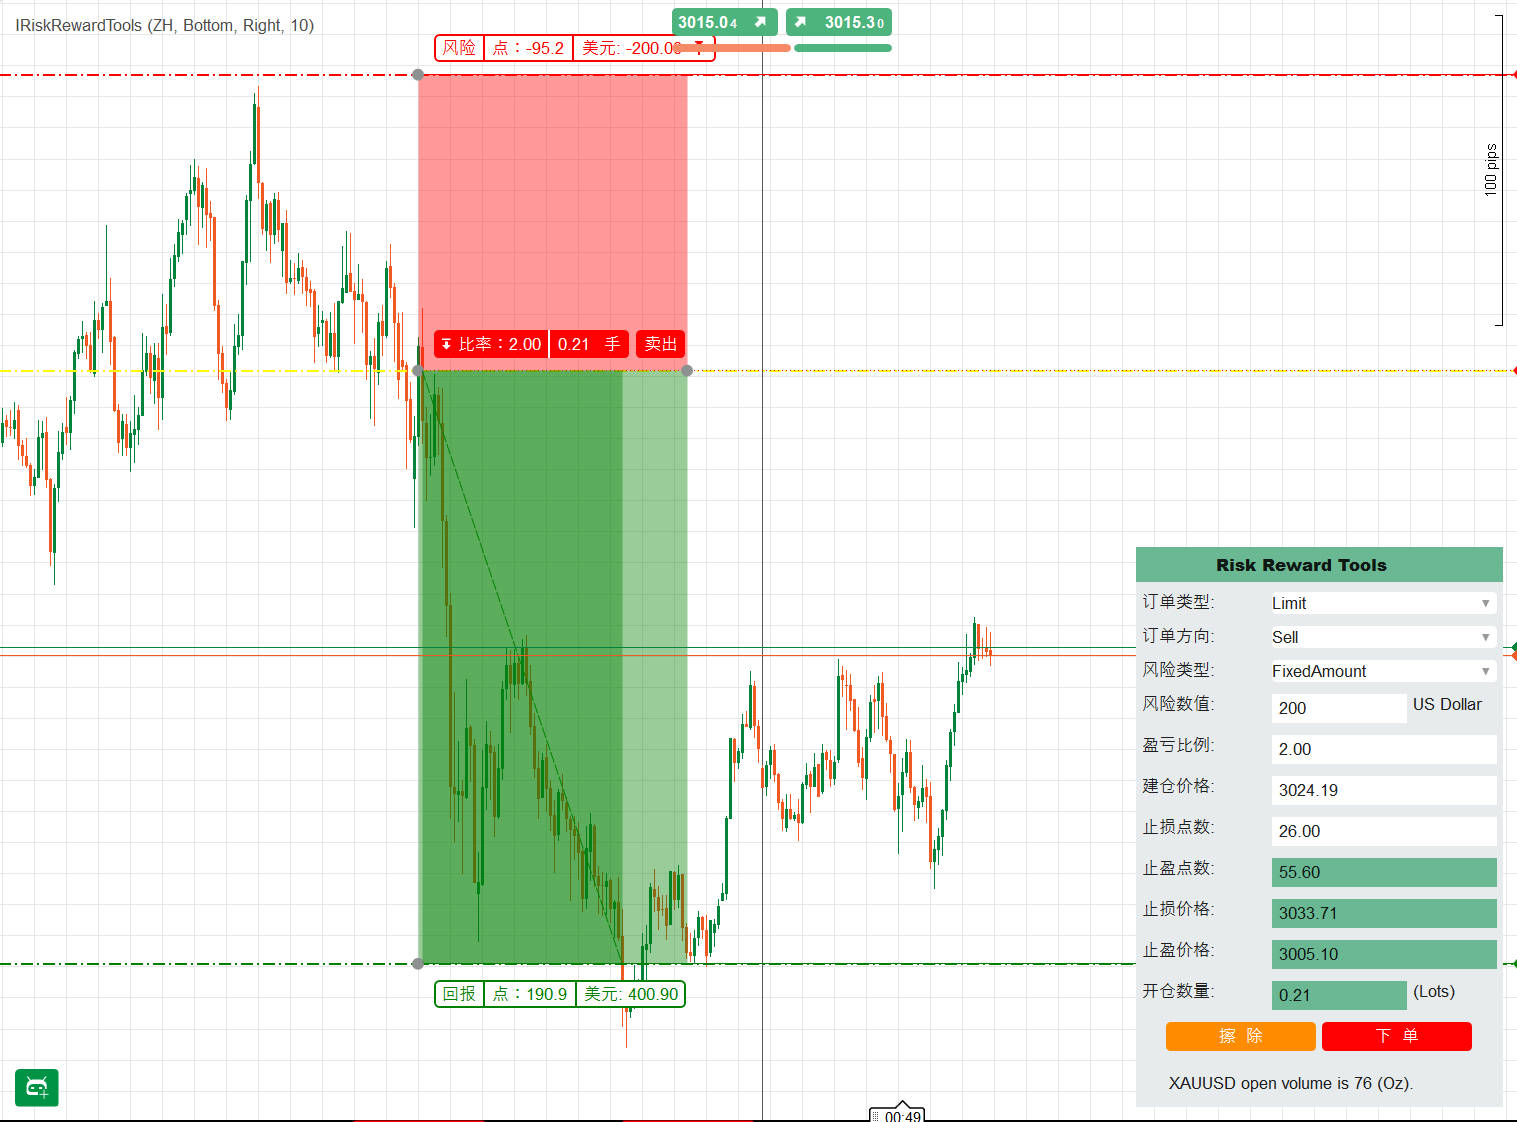
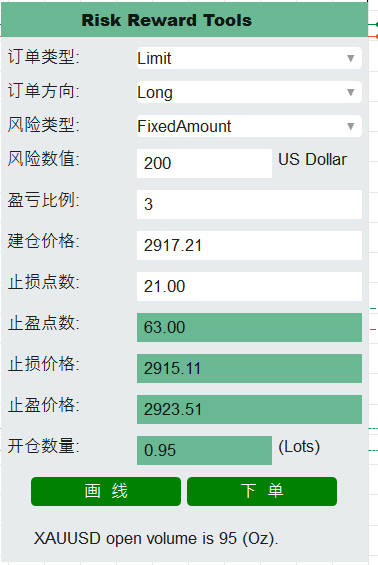
首先,这个指标是一个风险管理工具,用户界面有各种输入控件,如下拉菜单、文本框和按钮,用于计算订单的手数、止损、止盈等参数。用户可以选择订单类型(限价、市价、止损)、方向(多空)、风险类型(固定金额或百分比),输入风险值、风险回报比、建仓价格,然后计算相应的止损价格,止盈点数、价格,以及手数,并提供下单功能。说明如下:

1) 订单类型:限价单,市价单,止损单:

2) 风险方式:固定金额(比方200美元,用户可输入),账户余额百分比(比方1%,用户可输入);

3) 盈亏比:用户可以自行输入,比方3倍。系统根据设置值,自动计算可开仓手数,开仓价格,止损点数和价格,止盈点数和价格;

4) 建仓价格:默认是当前品种的当前价格,用户可自行修改输入;

5) 止损点数:输入止损点数,自动计算开仓手数,止损价格,止盈价格等信息,并可通过画线功能在图表上看相关位置信息;

6) 开仓手数:自动计算;

6)止盈:自动计算(包括点数和价格);

7)止损:自动计算(包括点数和价格)。

界面最下方是“下单”按钮,实现对上述参数设置的执行下单操作。请看视频介绍:

More from this author
Indicator
Breakout
Pivot Points Daily Session
Pivot Point with base zone daily Asia-London-New york Session.
Volume Weighted Average Price
VWAP is a powerful tool for intraday traders
Indicator
RSI
Breakout
MACD
ZigZagColor
The ZigZag indicator is a technical analysis tool primarily used to identify key price reversal points.
SuperEmaColorRSI
This is a super indicator that integrates the RSI indicator with a dual moving average system.
You may also like
Time Marker
CaptraTimeMarker: Marks key trading hours with lines & labels, plus daily separators for cTrader. Customizable & precise
IR Candle MTF
with this indicator you could see other time frame candle in your chart.
Indicator
RSI
Breakout
Supertrend
All Support and Resistance Levels
"Identify key market zones and visualize support/resistance from multiple timeframes on a single chart.
FBX Flow VPVR
FBX Flow VPVR é um indicador profissional de Volume Profile
Indicator
Indices
RSI
Signal
+1
[Stellar Strategies] QQE
The QQE indicator is a technical analysis tool designed to identify potential trend changes and trading signals 📈📉
Buy and sell indicator
Buy and Sell Signals
Indicator
RSI
Breakout
MACD
ZigZagColor
The ZigZag indicator is a technical analysis tool primarily used to identify key price reversal points.
Indicator
RSI
Indices
Signal
Rsi + Volume
This indicator combines RSI (Relative Strength Index) with volume analysis to generate more reliable trading signals.
RT TradingView ATR
Upgrade to ATR-RMA! Experience the precise ATR using Relative Moving Average for accurate volatility analysis in cTrader
E7 Volume Profile
E7 Volume Profile, more modern look and feel.
Daily Sessions HighLow Helper
Shows daily and sessions highs / lows and session boxes, everything configurable
Indicator
Signal
FairValueGap-PremiumVersion1
This Fair Value Gap (FVG) indicator is a technical analysis on multi-timeframe.
Indicator
RSI
Indices
RSI
RSI Pro Tool – Overbought & Oversold Made Easy
Indicator
RSI
Indices
Breakout
+9
Advanced HTF Trend Buy & Sell Trading System
Detects breakouts 📈 auto-draws levels 🚀 confirms trends 🐻 dynamic signals 🎨 customizable for any asset & timeframe.
Indicator
Indices
Forex
USDJPY
Yen Index w HMA
Yen Index
Indicator
Indices
RSI
Stocks
+3
Advanced RSI Indicator
Advanced RSI Indicator with multi-MA smoothing, Bollinger Bands, divergence detection, and fill zones for cTrader.
Drawing Utility
A rectangular box with 5 adjustable Fibonacci level or even custom ones.
High TF Plotter
Captra High TF Plotter visualizes high timeframe Bar on lower timeframe charts, highlighting with bull/bear colors.