Volume Weighted Average Price
"Volume Weighted Average Price" logo
17/09/2025
3
Desktop
Since 30/09/2024
Sales
34
"Volume Weighted Average Price" uploaded image

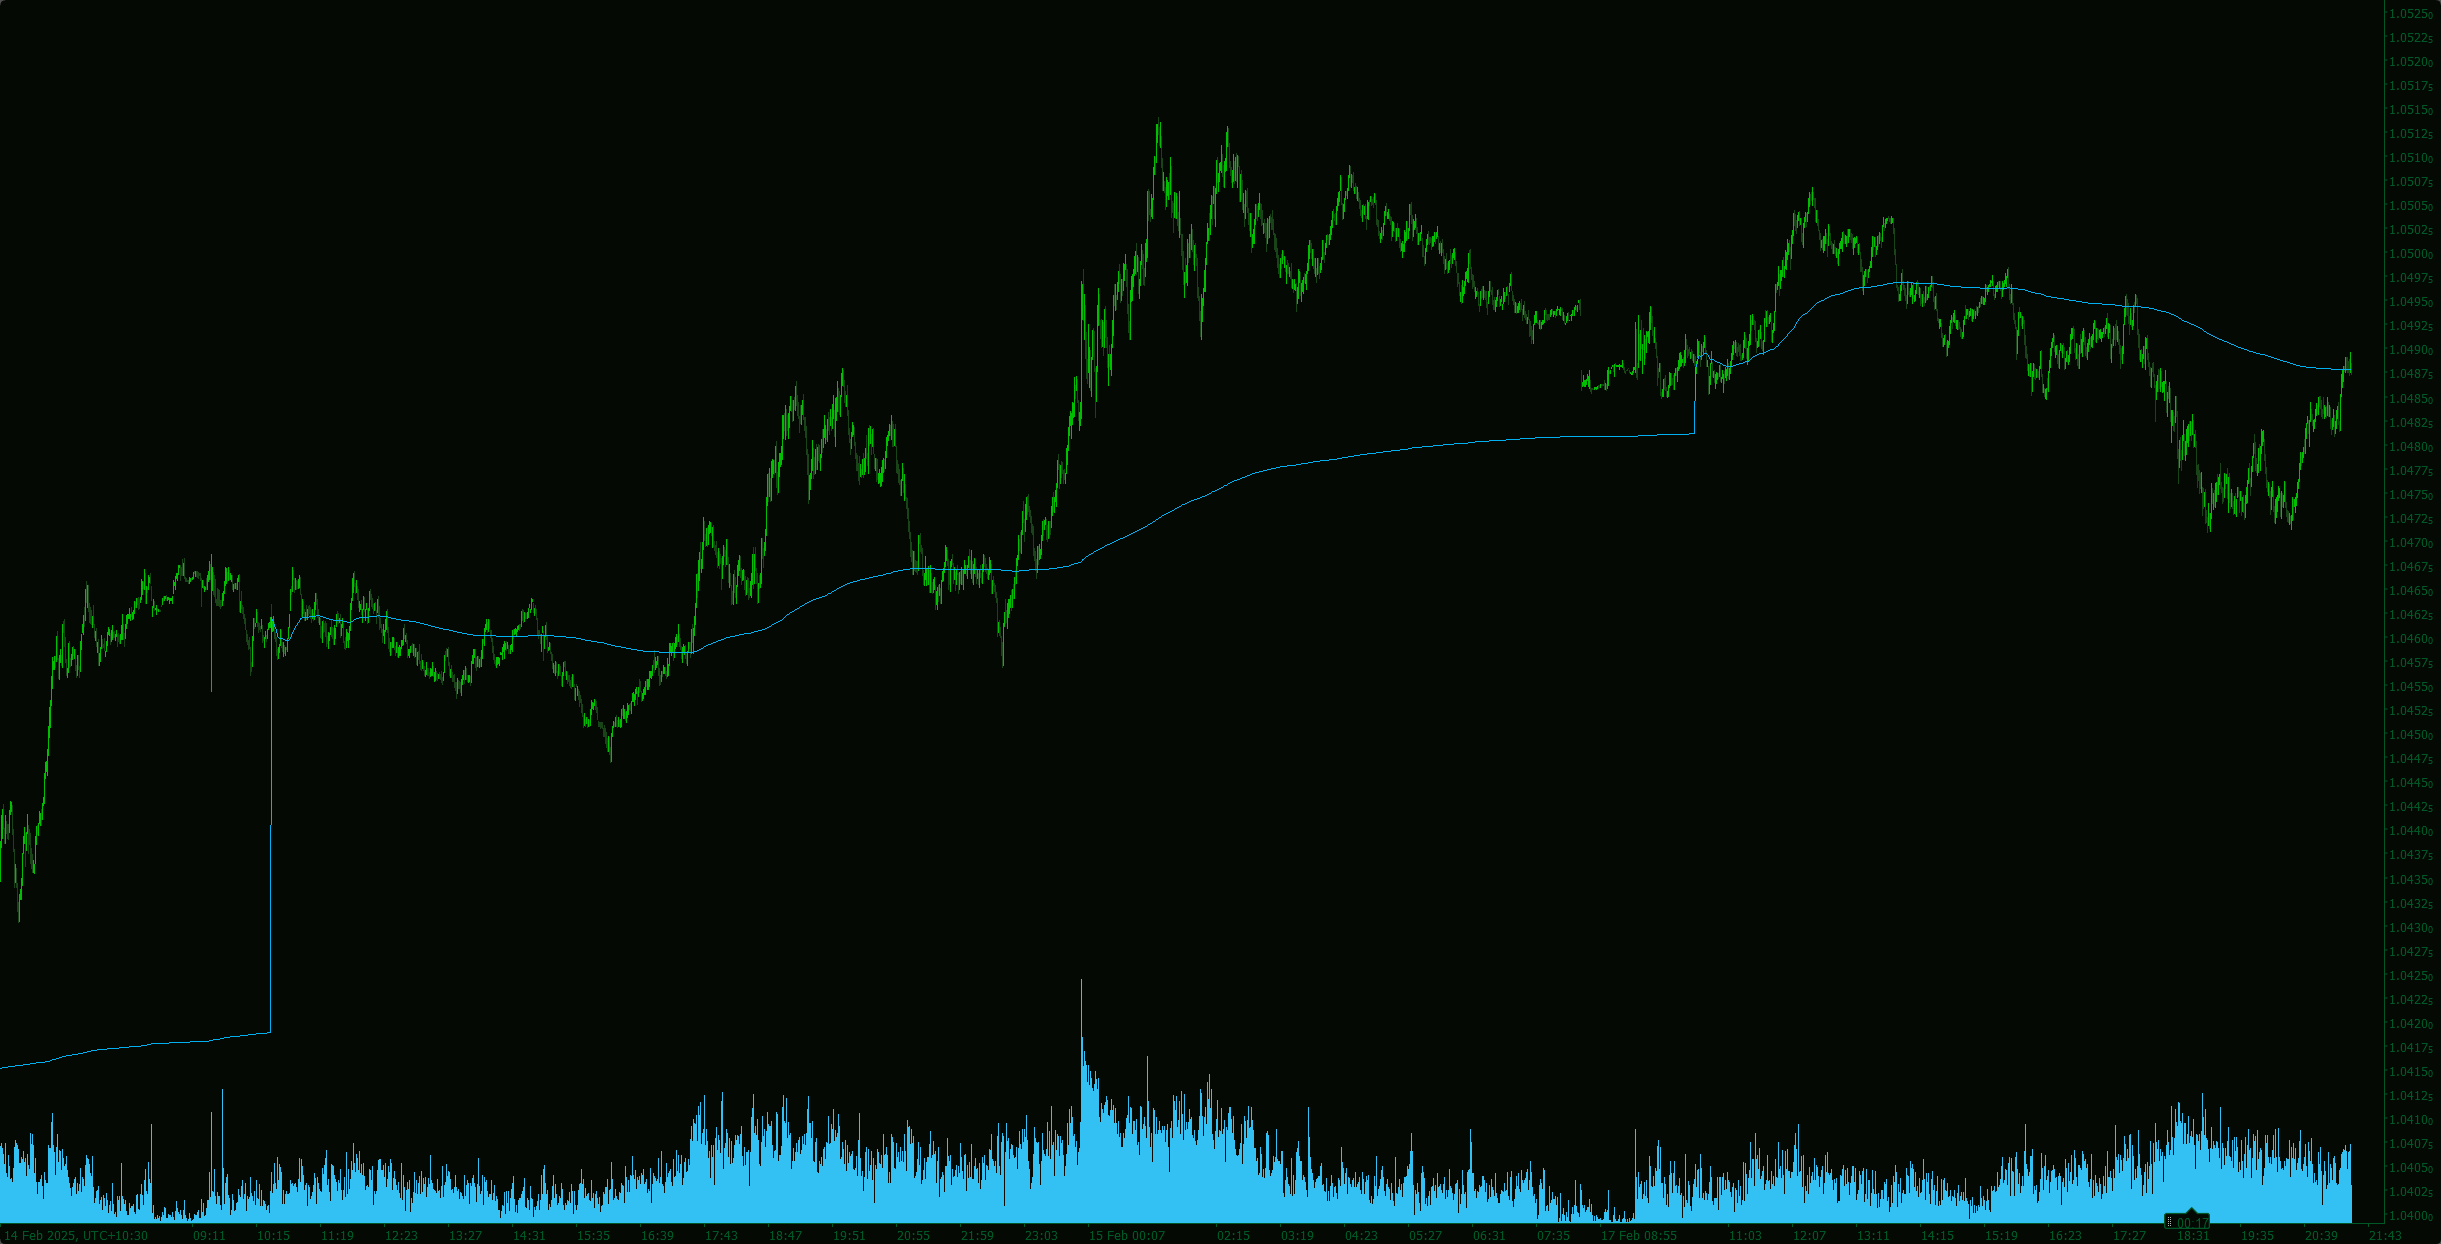
VWAP (Volume Weighted Average Price) is a trading benchmark that calculates the average price of an asset adjusted by trading volume over a specified period. It is widely used by day traders, institutions, and algorithmic trading systems to assess fair value and optimize trade execution.

Key Formula:

VWAP=∑(Price×Volume)​/∑Volume

  • Price = Typical price (High + Low + Close) / 3 or just Close price.
  • Volume = Trading volume for each period.

2. Why Use VWAP?

Purpose:

1)Fair Value Reference

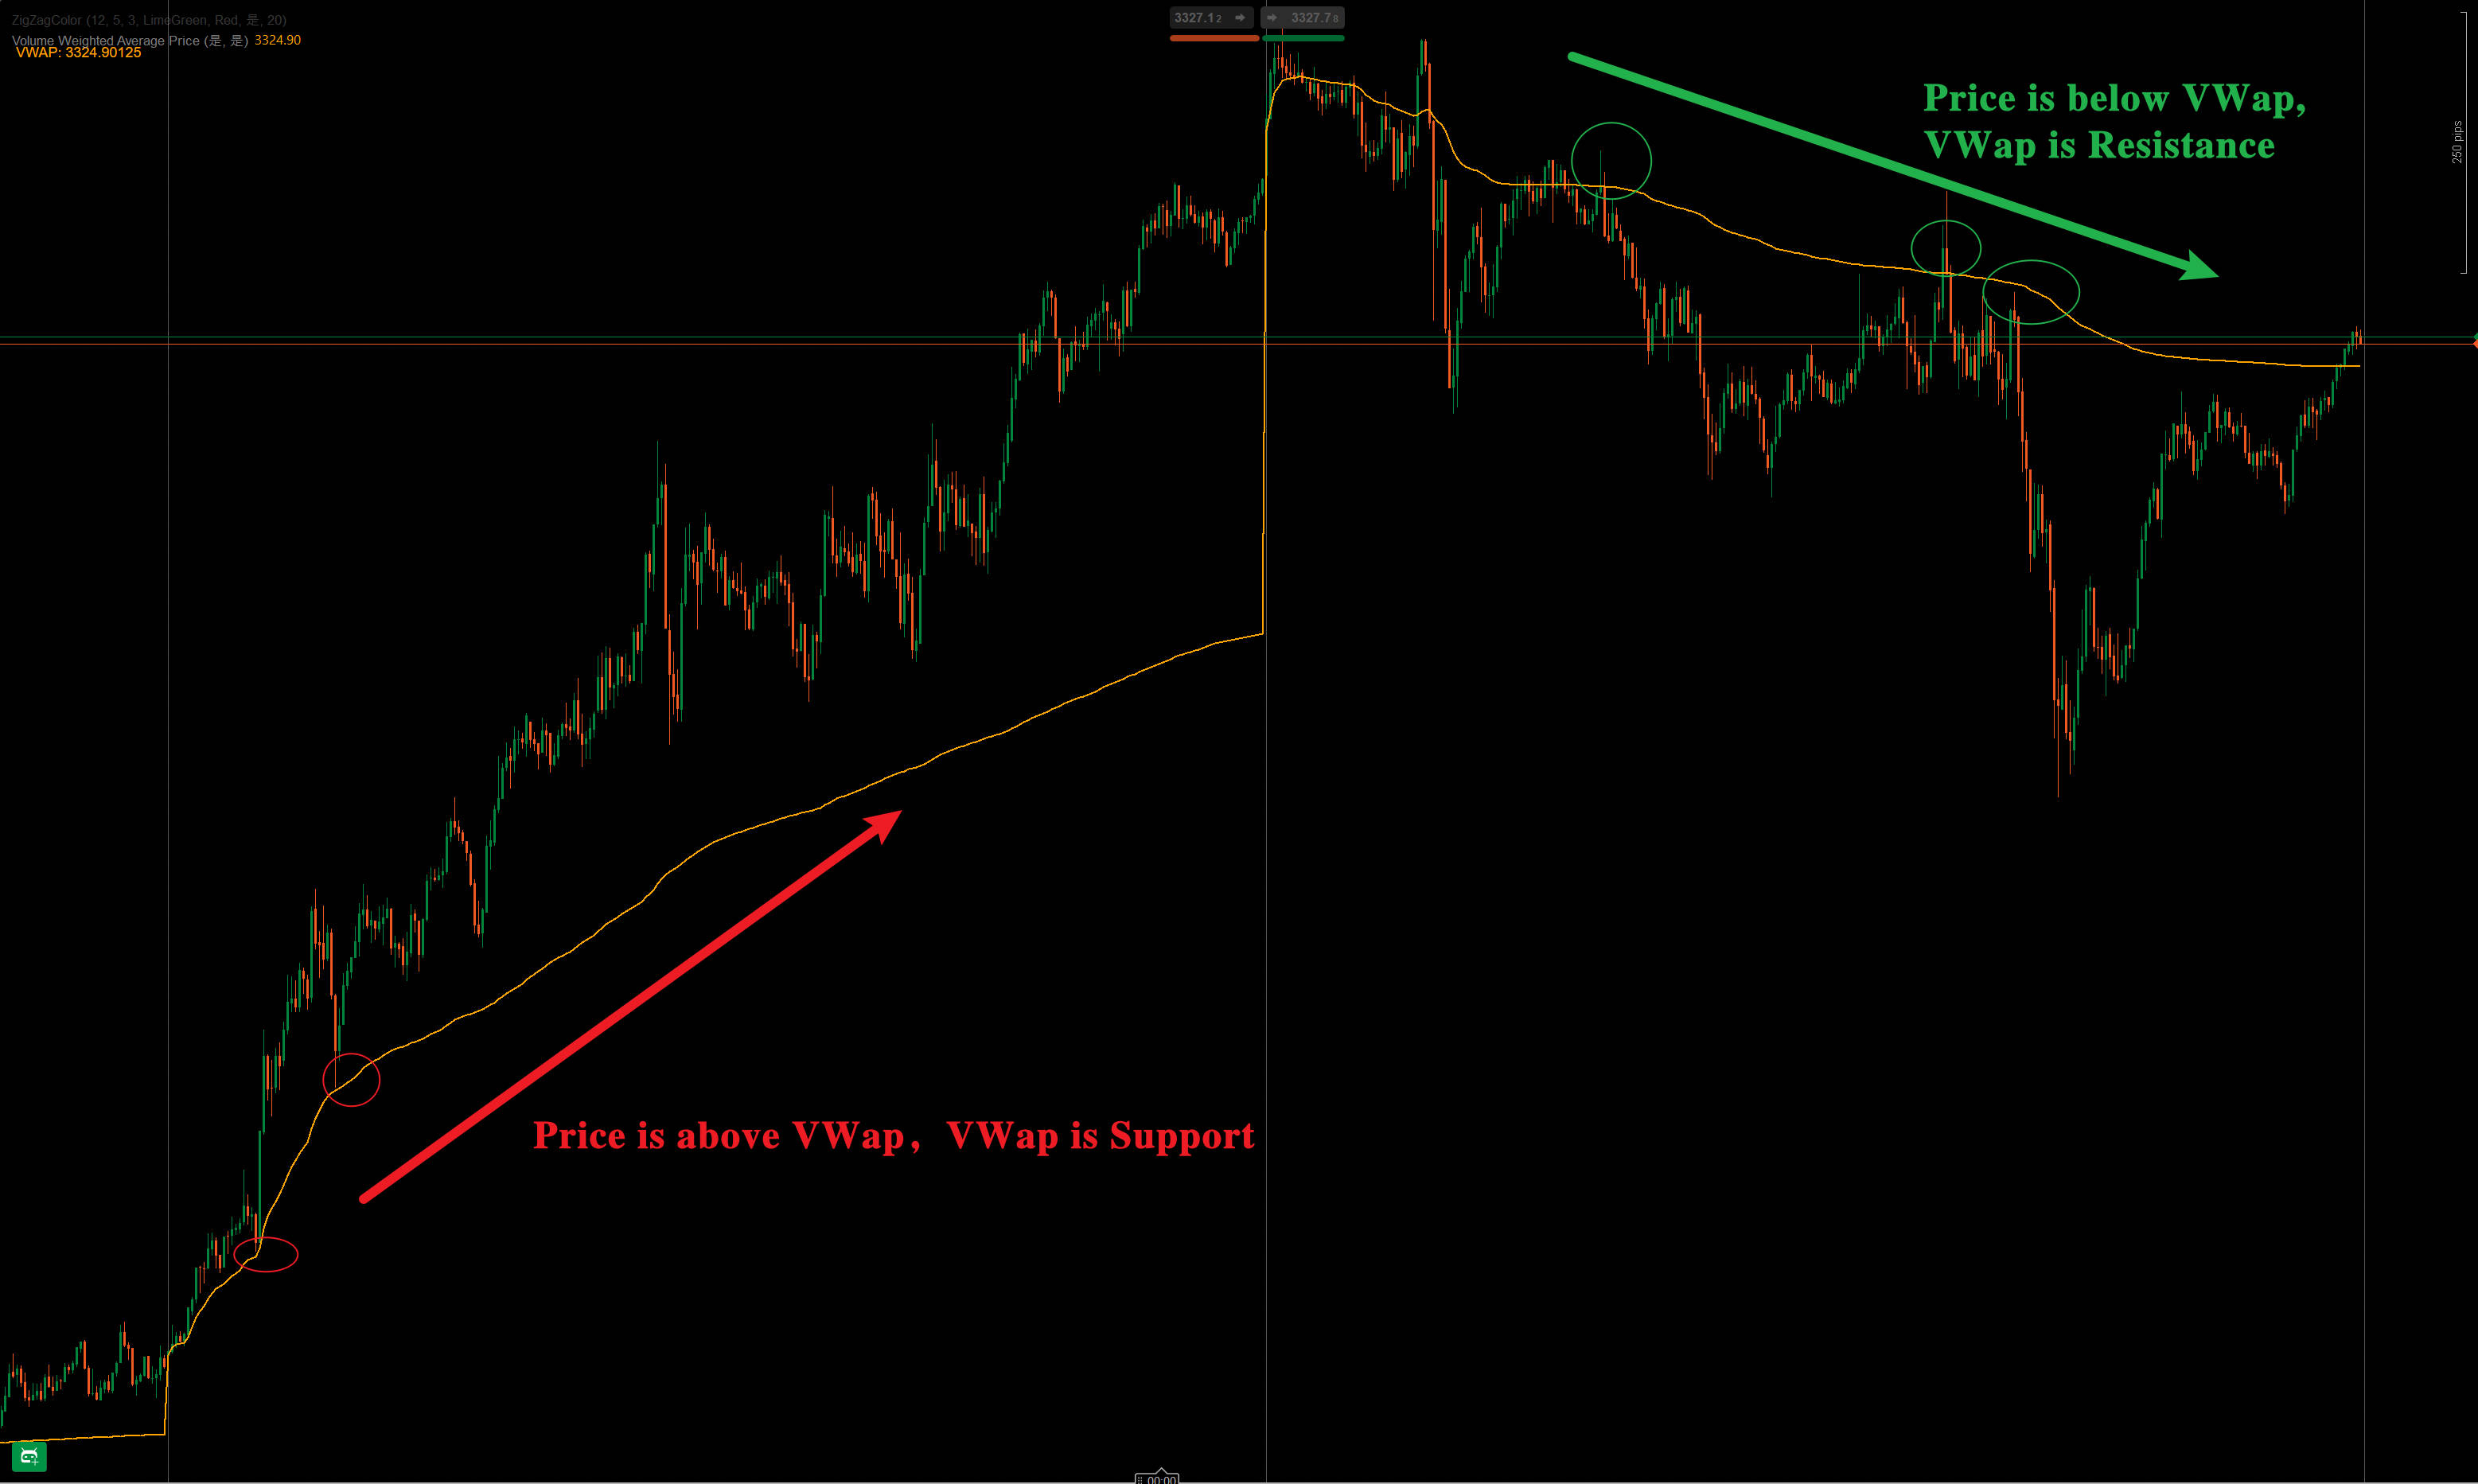
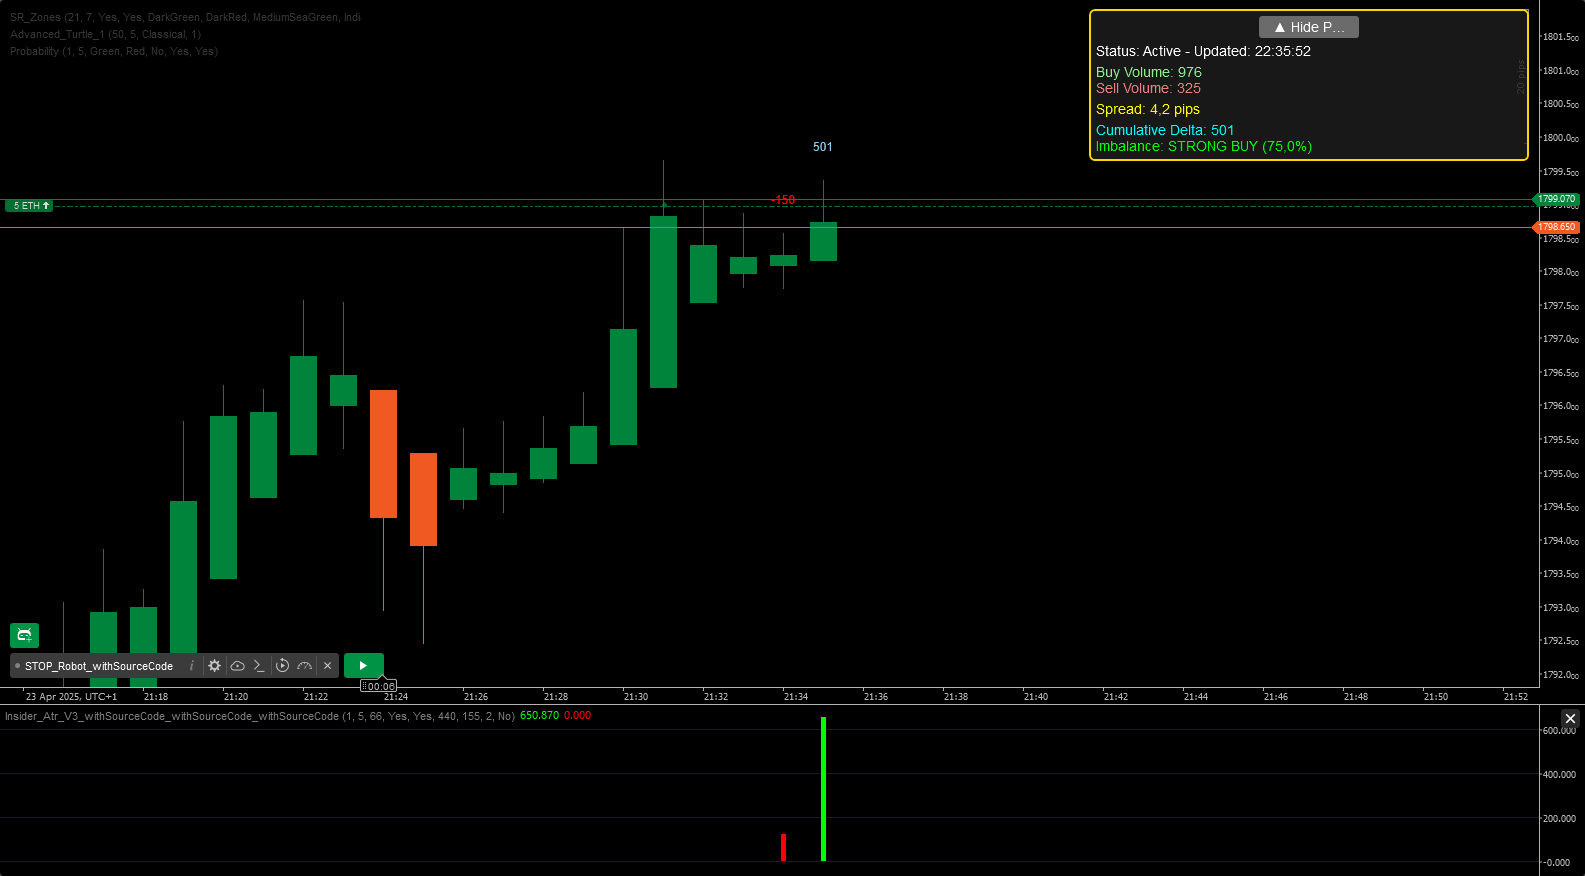
Price > VWAP = Bullish bias; Price < VWAP = Bearish bias.

2)Dynamic Support/Resistance

Acts as a key level for intraday breakouts/reversals.

3) Trend Confirmation

Price holding above VWAP = Uptrend; Below = Downtrend.


Volume Weighted Average Price (VWAP) 指标详解及用法

1. 基本概念

VWAP(成交量加权平均价) 是一种技术分析工具,用于衡量资产在特定时间段内的平均交易价格,并根据成交量进行加权计算。它帮助交易者判断当前价格相对于市场的“公平价值”,常用于日内交易、算法交易和机构执行订单。

核心公式

VWAP=∑(Price×Volume)​/∑Volume

每条K线的价格 × 成交量累加,再除以总成交量,得到动态加权均价。

2. VWAP 的主要用途

用途:

1)判断市场公允价格

价格高于VWAP = 偏强;低于VWAP = 偏弱。

2)支撑/阻力参考

VWAP常作为短线交易的动态支撑/阻力位。

3)日内趋势确认

价格持续在VWAP上方 = 多头主导;下方 = 空头主导。

More from this author
Indicator
Breakout
Pivot Points Daily Session
Pivot Point with base zone daily Asia-London-New york Session.
IRiskRewardTools
Risk Reward Management Tools(风险回报管理工具)
Indicator
RSI
Breakout
MACD
ZigZagColor
The ZigZag indicator is a technical analysis tool primarily used to identify key price reversal points.
SuperEmaColorRSI
This is a super indicator that integrates the RSI indicator with a dual moving average system.
You may also like
Order Block detector PRO
Order Block PRO — Smart Institutional Zone Detector
DMG Indicator POSIZIONE APERTE e Prezzi ,SU GRAFICO
Visualizzazione delle Posizioni dei simboli attivi su grafico
JMA-Like
JMA-like is a highly responsive and ultra-smooth moving average designed to replicate the behavior of the original JMA!
Indicator
Indices
Stocks
Commodities
+2
DayOfWeek - FXMaster
Day of Week Indicator for cTrader
Ichimoku Kinko Hyo
Ichimoku Kinkō Hyō with fixed shift to 25 as Ctrader calculate it from 0 and values was wrong for Chikou Span and Kumo.
Insider_CumulativeDelta
Robust Cumulative delta,Atr and imbalance indicator.
ZigZag Price Liquidity Projection
📊 ZigZag Liquidity Projection: Predict bounces/breaks using pivots, ATR & volume.
Indicator
NAS100
Indices
XAUUSD
+7
InstitutionalSignalOscillator
A precision-engineered indicator designed for traders who demand signal integrity across volatile markets.
VegaXLR - ZigZag Alerts
cTrader ZigZag Alerts: Precision Swing Detection, Alerts, and Fibonacci.
Indicator
Indices
Breakout
Supertrend
[CB] Pivot Points Pro
You can use the cTrader Pivot Points Pro indicator to find a good pullback entry in a trend
Renko Line Chart
Smart Signal Reversal Trend + Patterns
Fibonacci Pitchfan
Powerful all-in-one tool for traders seeking a clear, dynamic view of market structure. By merging pivots, trendlines &
Indicator
RSI
XAUUSD
Breakout
+4
ICT Power of 3
🎯 Auto-plots key zones (Accumulation, Manipulation, Distribution) . Reveals institutional traps & trends.
VegaXLR - Fibonacci Bands
Customizable Dynamic Fibonacci Channels and Smart Alerts
Indicator
NAS100
NZDUSD
Breakout
+12
Supertrend - Multi-Timeframe
Supertrend - Multi-Timeframe Indicator
Indicator
RSI
Breakout
XAUUSD
+12
Liquidity Pressure Index
Liquidity Pressure Index is a tool that gives traders deeper insights into the hidden dynamics of market liquidity
Indicator
NAS100
NZDUSD
Breakout
+12
Samurai Breakout Pro II
⚔️Full breakout trading workstation: session box, EP/TP/SL levels, on-chart ✓/✗ outcomes, pro-level analytics and more⚔️
VWAP Tokyo Open
VWAP Set to Tokyo Open