present
Inscrivez-vous et bénéficiez d'une remise de 50 $ sur votre premier achat
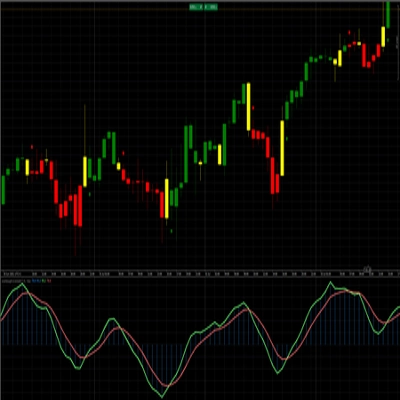
Trading product for Royal liquidity X Indicateur Supertrend Liquidity Sweep, image 1
Royal liquidity X
Indicateur
Version 1.0, May 2026
Windows, Mac
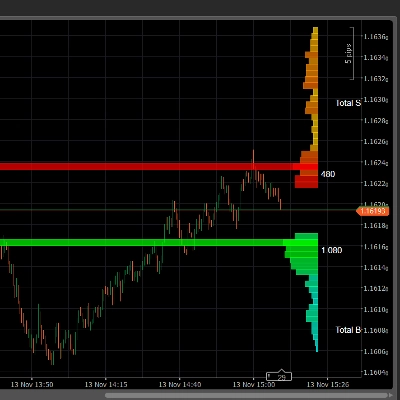
Trading product for Royal liquidity X Indicateur Supertrend Liquidity Sweep, image 2
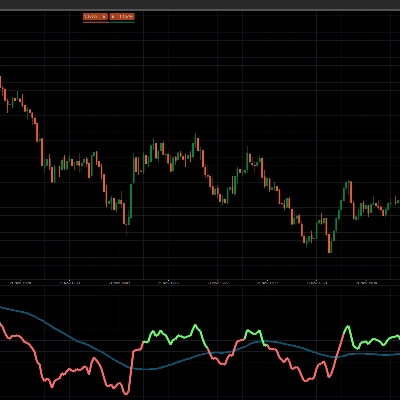
Trading product for Royal liquidity X Indicateur Supertrend Liquidity Sweep, image 3
86
Ventes
1.18K
Installations gratuites

Description

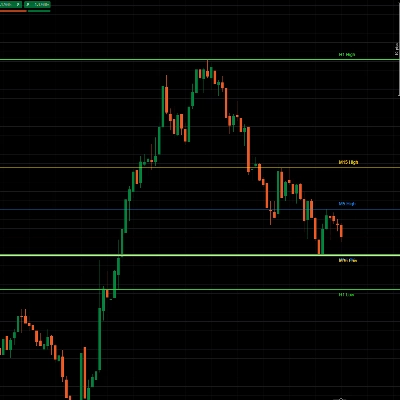
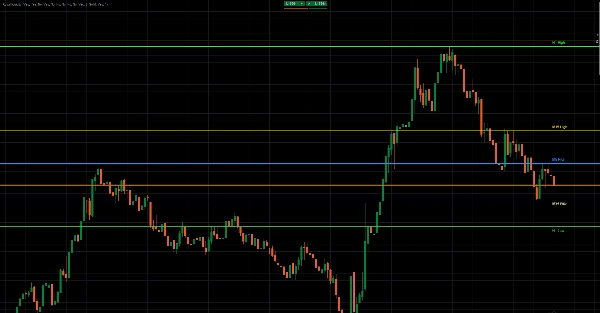
Royal Liquidity X is a clean and powerful multi-timeframe liquidity level indicator designed to display the previous high and previous low from multiple key timeframes directly on the chart.

The indicator helps traders quickly identify important liquidity zones where price may react, sweep liquidity, reject, break out, or continue with momentum. By plotting previous highs and lows from timeframes such as M5, M15, M30, H1, H2, H3, H4, H8, H12, and D1, Royal Liquidity gives traders a clear overview of the most relevant intraday and higher-timeframe liquidity levels.

These previous highs and lows are often watched by traders because they can act as potential stop-loss zones, breakout areas, reversal points, or price magnets. Royal Liquidity makes these levels visible automatically, without the need to manually draw them every session.

How It Works

Royal Liquidity reads the most recently closed candle from each selected timeframe. For every enabled timeframe, it takes the previous candle’s high and low and plots them as horizontal levels on the active chart.

For example:

M15 High = High of the last closed M15 candle
M15 Low = Low of the last closed M15 candle
H1 High = High of the last closed H1 candle
H1 Low = Low of the last closed H1 candle
D1 High = High of the last closed daily candle
D1 Low = Low of the last closed daily candle

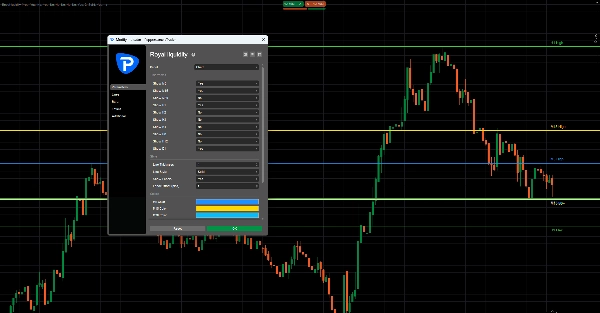
The indicator updates only on the latest chart bar, keeping the chart efficient and lightweight. Each timeframe can be turned on or off individually, and every level can have its own custom color. Traders can also adjust line thickness, line style, labels, and label offset.

What It Shows

Royal Liquidity can display:

Previous M5 High / Low
Previous M15 High / Low
Previous M30 High / Low
Previous H1 High / Low
Previous H2 High / Low
Previous H3 High / Low
Previous H4 High / Low
Previous H8 High / Low
Previous H12 High / Low
Previous D1 High / Low

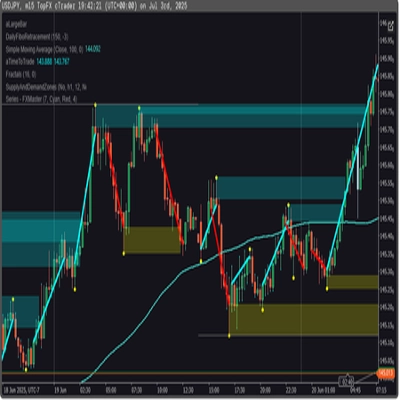
Each level is drawn as a horizontal line, with optional labels such as M15 High, M15 Low, H1 High, H1 Low, and D1 High / Low.

Trading Use Cases

Royal Liquidity can help traders identify:

Liquidity sweeps
Price may move above a previous high or below a previous low to collect liquidity before reversing.

Breakout zones
A strong break above a previous high or below a previous low can signal continuation or momentum.

Reversal areas
Previous highs and lows can act as important reaction zones where price may reject.

Intraday targets
Higher-timeframe highs and lows can be used as potential target zones.

Market structure context
The indicator helps traders see where price is trading relative to important previous candle levels.

Short Marketplace-Style Version

Royal Liquidity is a multi-timeframe previous high and low indicator built to reveal key liquidity levels directly on your chart. It automatically plots the previous highs and lows from selected timeframes, including M5, M15, M30, H1, H4, H12, and D1.

Designed for liquidity-based traders, breakout traders, scalpers, and intraday traders, Royal Liquidity helps identify potential sweep zones, breakout areas, reversal levels, and profit targets with a clean visual layout.

Disclaimer

Royal Liquidity is a technical analysis tool and does not guarantee profitable trades. It should be used together with risk management, market structure analysis, and a complete trading plan.

Résumé

Profil de l'indicateur
Catégorie de l'indicateur
Tendance
Type de résultat
Signaux
Exigences en matière de données
Données de tick
Signaux pris en charge
Cassure
Croisement
Dépassement de niveau
Inversion

Discussion

Avis clients

0.0
Avis : 0
Avis clients
Il n'y a pas encore d'avis sur ce produit. Vous l'avez déjà essayé ? Soyez le premier à en parler aux autres !

Questions fréquentes

Supertrend
Liquidity Sweep
Liquidity Grab
Les produits disponibles sur cTrader Store, notamment les bots de trading, les indicateurs et les plug-ins, sont fournis par des développeurs tiers et mis à disposition à titre informatif et à des fins d'accès technique uniquement. cTrader Store n'est pas un courtier et ne fournit aucun conseil en investissement, aucune recommandation personnelle ni aucune garantie quant aux performances futures.

Plus de cet auteur

Indicateur
AI
ATR
+27
SR Commander is a clean and intelligent support and resistance indicator for cTrader, built to help traders identify key
Indicateur
AI
ATR
+20
Buy and Sell Signals
Indicateur
AI
ATR
+27
WICK COMMANDER — Know Exactly When the Market Commits
Indicateur
AI
ATR
+27
Overbought Oversold Indicator
Indicateur
AI
ATR
+20
Know Sure Thing (KST) momentum engine
Indicateur
AI
SMC
+5
Coloring trendline/ Colored Trendline / Color Trendline
Indicateur
AI
ATR
+27
VWAP Sniper Elite -- Institutional Trend Engine
Indicateur
AI
SMC
+13
Dynamic Liquidity Depth exposes hidden volume
Indicateur
AI
ATR
+26
Entry Momentum MACD Power Guide
Indicateur
AI
ATR
+27
The Professional “All-in-One” Trading Suite (buy and sell indicator)
Indicateur
AI
ATR
+26
SR Commander — Multi Timeframe Edition. See where the big money draws the line. Trade on your timeframe. Think on theirs
Logo de "crossover 1"
Les mieux notés
4.2
(5)
$19
/
$29
Indicateur
AI
Grid
+10
Crossover Buy and Sell Alerts and signals

Vous pourriez aussi aimer

Indicateur
Forex
Crypto
+3
Consecutive Series Moves — Reveal the True Pulse of Price Action
Logo de "SCOB"
Les mieux notés
4.4
(5)
$19
/
$20
Indicateur
SMC
Prop
+12
SCOB - Single Candle Order Block Indicator
Indicateur
ATR
MSS
+5
Advanced market structure and institutional cycle mapper with visual reference cards and entry alerts
Indicateur
AI
ATR
+26
MacD Custom Indicator-Multiple Time Frame
Indicateur
AI
Prop
+9
A cutting‑edge trading indicator that fuses AI and mathematics with adaptive logic to classify market regimes.
Indicateur
ATR
BOS
+3
Fair Value Gaps with Multi-Timeframe.
Indicateur
ATR
EMA
+5
Candle timer with live profit tracking on chart – displays pips, currency value, and percentage in real time.
Indicateur
RSI
Forex
+4
😎Read the description before purchasing💩
Indicateur
MACD
Prop
+8
NTNPICLL is a tool to check the best trading hours for the assets and also includes the highest and lowest point
Indicateur
Market Sessions
Indicateur
ATR
Forex
+5
Most used candle patterns. (1 candle, 2 candles and 3 candles patterns) and Marubozu. Bonus Fibo Risk control.
Indicateur
ATR
RSI
+6
💹 Define a price channel 📈 and determine trend direction (bullish 🟢 or bearish 🔴).
Indicateur
ADX
ATR
+5
Configure, simulate, and analyze trading strategies with custom filters, multi-target exits, and detailed performance me
Indicateur
Prop
VWAP
+5
VWAP is a powerful tool for intraday traders
Indicateur
SMC
Prop
+12
Multi-TF FVG + Smart Fibonacci
Logo de "CandleCounterAlex"
Les mieux notés
4.7
(4)
$19
Indicateur
CandleCounterAlex – Candle Cycle Counter with Colors and Adjustable Position.
Indicateur
RSI
Breakout
+1
🚀 TrendHeikinMultiMA: Advanced trend detection using Heikin-Ashi smoothing & MAs! Eliminates noise, confirms real trend
Indicateur
ATR
BTCUSD
+5
Trailing algo 📈 auto-tracks trends 🎯 adapts to volatility 🌟 precise moves 🛡️ retest signals 🚀 no lag, smart market

Prix

86
Ventes
1.18K
Installations gratuites