
الوصف
حوّل فوضى الأسعار إلى قنوات اتجاه واضحة باستخدام رياضيات الانحدار الدقيقة.
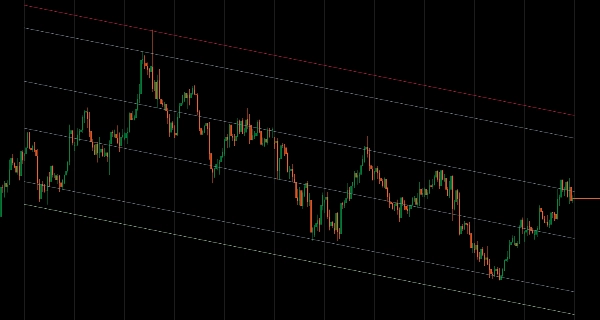
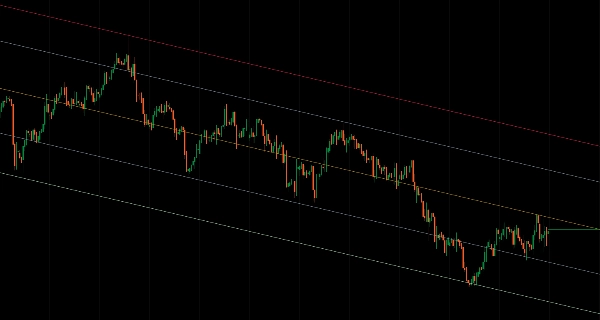
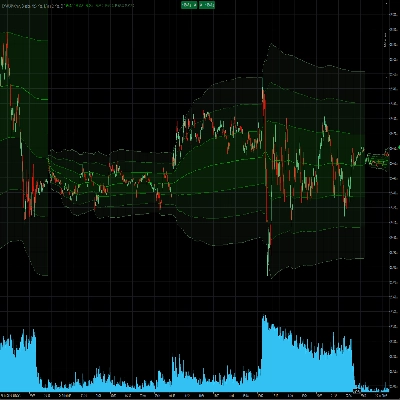
يقوم قناة الانحدار بحساب خط انحدار خطي من خلال بيانات السعر التي تختارها ويرسم حدودًا علوية/سفلية بناءً على انحرافات السعر - مما يمنحك رؤية إحصائية لاتجاه الاتجاه ومناطق الانعكاس المحتملة.
مثالي لـ
- المتداولين الهيكليين الباحثين عن تعريف موضوعي للاتجاه
- متداولي الانعكاس المتوسط الذين يحددون حالات التشبع الشرائي/البيعي
- متداولي الاختراق الذين يكتشفون انتهاكات القناة وتحولات الزخم
- تحليل متعدد الأطر الزمنية - رسم الانحدار الشهري على الرسوم اليومية للسياق
الميزات الرئيسية
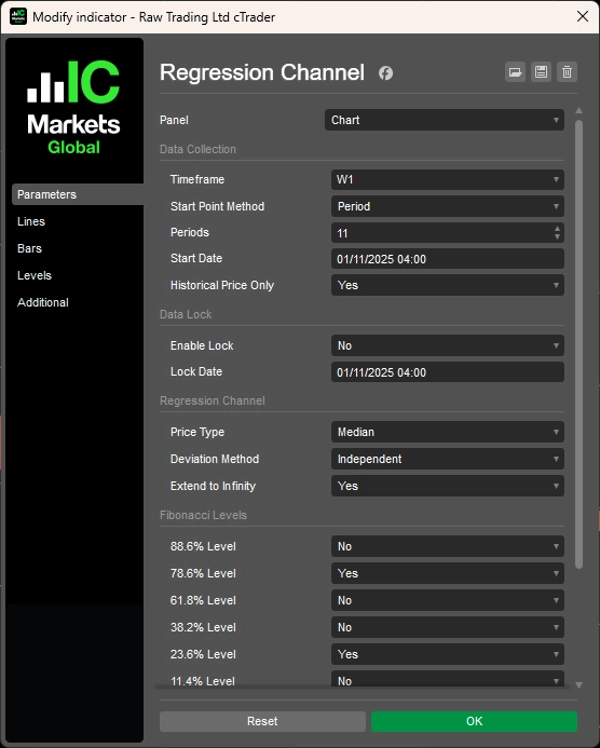
- اختيار بيانات مرن
-
- وضع الفترة: تحليل آخر N شريطًا (مثلاً، آخر 12 شمعة شهرية)
- وضع التاريخ والوقت: البدء من أحداث أو تواريخ سوق محددة
- آلية القفل: تجميد التحليل عند نقطة تاريخية بينما يستمر السعر
- متعدد الأطر الزمنية: رسم الانحدار من أي إطار زمني على الرسم الحالي
- طرق انحراف ذكية
-
- المتوسط: مستويات متوازنة باستخدام الانحرافات المتوسطة (مثالي لمناطق التداول)
- مستقل: قنوات غير متماثلة تتكيف مع تقلبات الاتجاه
- الأقصى: يعرض حدود السعر القصوى لتحليل النطاق الكامل
- أدوات احترافية
-
- 6 مستويات تصحيح فيبوناتشي (11.4٪، 23.6٪، 38.2٪، 61.8٪، 78.6٪، 88.6٪)
- 6 أنواع أسعار: الافتتاح، الأعلى، الأدنى، الإغلاق، الوسيط، النموذجي
- وضع التاريخ فقط: استبعاد الأشرطة المتشكلة للاختبار الخلفي المستقر
- خيار التمديد إلى اللانهاية للتوقعات طويلة الأجل
- تخصيص كامل للألوان
لماذا يتميز
على عكس أدوات الانحدار الأساسية، يمنحك هذا المؤشر السيطرة. قم بقفل تحليلك لدراسة كيفية تصرف السعر بعد حدث معين. التبديل بين القنوات المتماثلة وغير المتماثلة. دمج هيكل الإطار الزمني الأعلى مع تنفيذ الإطار الزمني الأدنى - كل ذلك مع كود نظيف وفعال مصمم للموثوقية.
رسوم بيانية نظيفة. هيكل واضح. قرارات واثقة.
الملخص
ملف تعريف المؤشر
تقييمات العملاء
0.0
التقييمات: 0
تقييمات العملاء
لا توجد تقييمات لهذا المنتج حتى الآن. هل جرَّبته بالفعل؟ كن أول من يخبر الآخرين!
مناقشة
الأسئلة الشائعة
Fibonacci
يتم توفير المنتجات المتاحة من خلال cTrader Store، بما في ذلك روبوتات التداول والمؤشرات والإضافات، من قبل مطوري الطرف الثالث وإتاحتها لأغراض الوصول المعلوماتي والفني فقط. cTrader Store ليس وسيطًا ولا يقدم نصائح استثمارية أو توصيات شخصية أو أي ضمان للأداء المستقبلي.


السعر
منذ 20/12/2024
8.28K
التثبيتات المجانية