说明
===============================================================================
Smart Money Map
===============================================================================
A Smart Money Concepts (SMC) indicator for cTrader. It projects market
structure and the related institutional trading concepts onto a single,
easy-to-read layer on the chart - without any ZigZag or other helper
indicator, computed purely from price data.
-------------------------------------------------------------------------------
[ WHAT IT DRAWS ]
-------------------------------------------------------------------------------
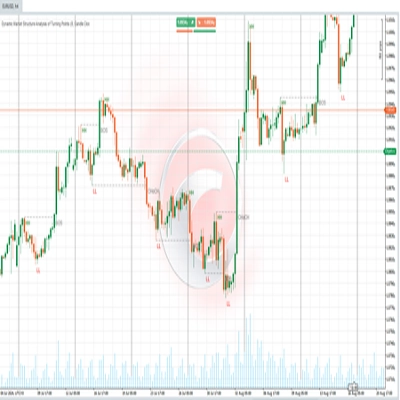
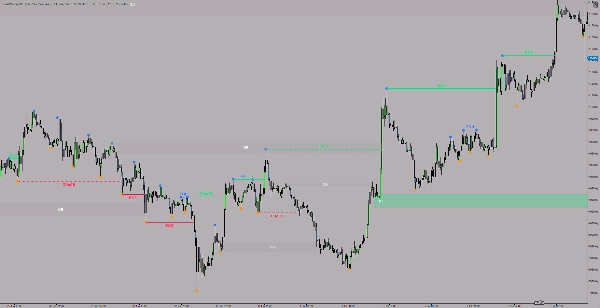
* Market structure (BOS / CHoCH)
A direction-based swing model tracks the structure, freezes a confirmed
swing point on every direction change, and flags Break of Structure (BOS)
and Change of Character (CHoCH) events as soon as a closed candle passes
through the relevant reference level.
* Swing points
Marks the confirmed local highs and lows.
* Equal High / Equal Low (EQH / EQL)
Highlights highs / lows of the same height, which often act as liquidity
zones. The "equality" tolerance is derived from the recent average bar
range (High - Low), not from an external ATR.
* Order Block (OB)
Order block zones that originate only from a CHoCH and are confirmed by
an FVG (Fair Value Gap). The zone is refined onto a finer timeframe and
Its full life-cycle is tracked: active -> mitigated (tapped) -> broken.
-------------------------------------------------------------------------------
[ KEY BENEFITS ]
-------------------------------------------------------------------------------
(+) Non-repaint
It processes only closed candles; the currently forming candle never
creates a swing or an event. Once something is drawn, it stays in place.
(+) No external dependency
All calculations come from native price data - no ZigZag, no ATR, no other
indicator loaded.
(+) Multi-timeframe
The structure can be computed on the chart timeframe or on a separately
selected timeframe, while the markers snap exactly onto the candles of
the displayed chart (weekend / session gaps handled correctly). Order
blocks can be refined using a dedicated refine timeframe.
(+) Developer interface
It exposes a public query API (trend, swings, structure events, order
blocks), so cBots and other indicators can consume its output directly.
(+) Performance limits
Adjustable caps on the number of swing, event, EQH/EQL and order block
markers keep the chart clean and fast.
-------------------------------------------------------------------------------
[ CUSTOMIZATION ]
-------------------------------------------------------------------------------
- Display: Every layer (swings, BOS, CHoCH, labels, EQH/EQL, order blocks)
can be toggled independently; line thickness and label font size are
adjustable.
- Colors: Separate colors for swing high/low, bull/bear structure, EQH/EQL,
and bull/bear plus mitigated order block zones (with transparency).
- EQH/EQL: Lookback window (bars) and sensitivity (as a multiplier of the
average bar range).
- Order Block: Refine timeframe, maximum impulse-leg length, refine
scan-back depth.
- Timeframe: Use the chart timeframe, or choose a separate structure
timeframe.
-------------------------------------------------------------------------------
[ HOW TO USE ]
-------------------------------------------------------------------------------
1. Drag the indicator onto the chart.
2. Choose whether it computes on the chart timeframe or on a dedicated
structure timeframe (Timeframe group).
3. Enable the SMC layers you need (Display group).
4. Tune the EQH/EQL sensitivity and the Order Block settings to the given
instrument and timeframe.
Note: The indicator runs as an overlay on the price chart and requires no
access rights (AccessRights = None).
-------------------------------------------------------------------------------
[ WHO IT IS FOR ]
-------------------------------------------------------------------------------
Smart Money / ICT-minded traders who want to review market structure,
liquidity levels and order blocks with a single, consistent and non-repainting
tool - whether for manual analysis or cBot-based automation.
===============================================================================