
説明
価格予測ダイナミック 📈🔮
https://chartshots.spotware.com/c/69d5304ea1cc1
これは何ですか?
https://chartshots.spotware.com/c/69d52fb4b01cd
価格予測ダイナミック は、モンテカルロシミュレーションを使用して統計的に可能性の高い将来の価格パスを投影し、ベイズ確率分類器を通じて方向性のバイアスを評価するオーバーレイインジケーターです。1つの質問に答えます:この資産がこれまでどのように動いてきたかを考慮すると、次に統計的にどこに行く可能性が高いですか? 📊
https://chartshots.spotware.com/c/69d53010d38ce
仕組み ⚙️
エンジン1 — モンテカルロ予測 🎲
インジケーターは最近の価格履歴を分析し、対数リターンを抽出します。平均リターンとその標準偏差を計算し、資産のドリフト(傾向)とボラティリティ(不規則な動き)を捉えます 🌪️。
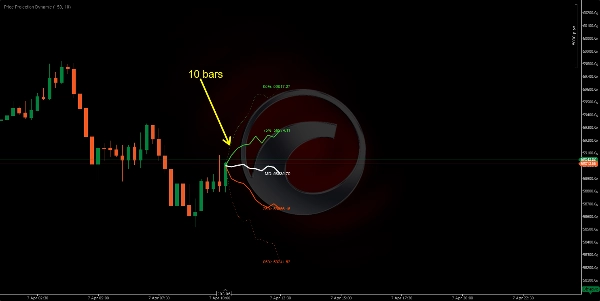
将来に向けて200のシミュレートされた価格パス(最大500)を実行します。各シミュレーションは実際の最近の動きを基にした「ランダムウォーク」です。これらから、インジケーターは5つのパーセンタイルバンドを抽出します:
バンド
意味
95%
楽観的な極値 — シミュレーションのうち5%のみがこれより高かった 🚀
75%
上位の可能性範囲 — 価格はシミュレーションの25%でこれを上回った 📈
50% (MD)
中央値予測 — すべての結果の統計的中心 🎯
25%
下位の可能性範囲 — 価格はシミュレーションの25%でこれを下回った 📉
05%
悲観的な極値 — シミュレーションのうち5%のみがこれより低かった 📉🛑
プロのヒント: ファンが広がるほど現在のボラティリティが高い 📢。ファンが狭い場合は資産が予測可能に動いている 🧵。
エンジン2 — ベイズ分類器 🧠
予測とは独立して、このエンジンは市場を強気または弱気として分類します:
- ウィンドウ(デフォルト500バー)を遡って調査 🔍。
- 強気対弱気バーのための相対出来高とモメンタムを測定。
- ガウス確率を使って現在のバーがどのプロファイルにより適合するかを計算 ⚖️。
結果は勝率パーセンテージです:
確率
解釈
> 70%
強い強気の自信 ✅🟢
50–70%
中程度 / 不明瞭 ⚖️🟡
< 30%
強い弱気の自信 ✅🔴
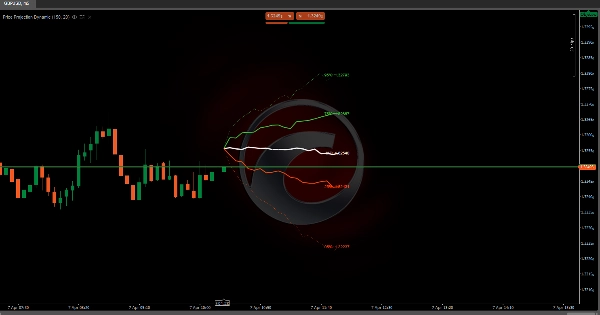
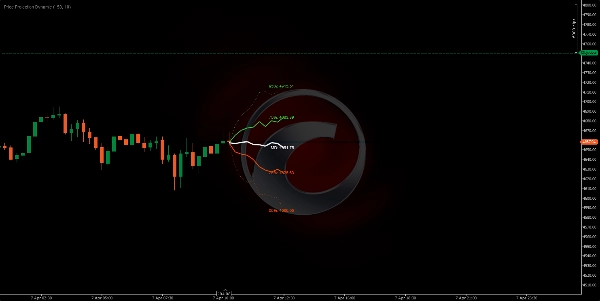
視覚要素 🎨
- 緑の線(75%、95%): 上位予測バンド — 強気範囲 🍏
- 白線(MD): 中央の予測価格 — 最も可能性の高いパス 🏁
- オレンジの線(25%、05%): 下位予測バンド — 弱気範囲 🍊
- 点線の外側の線: 95%と05%の極値(低確率境界) ⚠️
- 実線の内側の線: 75%、50%、25%(高確率ゾーン) ✅
- 価格ラベル: 各パーセンタイルの正確な予測価格 🏷️
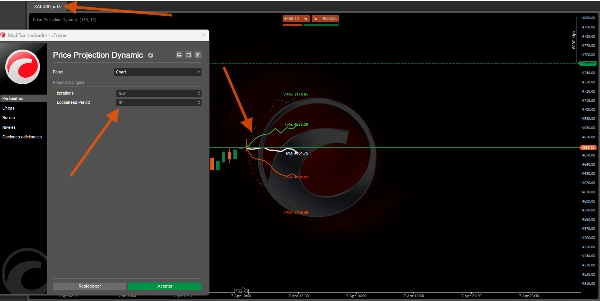
- 情報パネル(右上): ベイズ勝率、中央値ターゲット、相対出来高、シグナル方向 🖥️
使い方 📖
- ファンの形状を読む 📢 — 急速に広がる場合、ボラティリティが高く予測が不確実です。
- 中央値(MD)線を使う 🎯 最も統計的に可能性の高い将来の価格目標として。
- 75%/25%バンドを使う 📏 取引の現実的な上限/下限目標として。
- 95%/05%バンドを使う 🛑 極端な境界として — ストップロスの設定に役立ちます。
- ベイズパネルを確認する 🧠 — 70%以上または30%未満の確率は方向性の確信を高めます。
- 両方のエンジンを組み合わせる 🤝 — 中央線が上向きで かつ ベイズ確率が70%以上の場合、セットアップは統計的に強力です。
主要パラメータ ⚙️
パラメータ
制御内容
高い値
低い値
イテレーション数
シミュレートされたパスの数
より滑らかなバンド 🌊
より高速な計算 ⚡
先読み
将来の予測距離
より長い期間 🔭
より短く、より信頼性が高い 🔍
サンプル深度
分析する最近のバー数
長期的な挙動 🐢
最近の挙動のみ 🐇
分類器ウィンドウ
ベイズ履歴
より安定した確率 ⚖️
より反応的 ⚡
インジケータープロファイル 📋
- インジケーターカテゴリ: 統計 📊
- 出力タイプ: ビジュアライゼーション&シグナル 🖼️
- データ要件: バーのみ 📶
免責事項 ⚠️
このインジケーターは統計的確率を予測し、予言ではありません 🔮。モンテカルロシミュレーションは将来が最近の過去のようになると仮定していますが、これはブラックスワンイベント 🦢やニュースによるギャップの際には崩れます。独自のリスク管理と共に確率的枠組みとして使用してください 🛡️。
概要
Separately, the Bayesian classifier evaluates market sentiment by analyzing relative volume and momentum over a configurable window, providing a win probability percentage that indicates bullish or bearish confidence. Visual elements include color-coded projection bands (green for bullish, orange for bearish), a median price line, price labels for each percentile, and an info panel displaying Bayesian probability and other metrics.
Key adjustable parameters include the number of simulation iterations, projection horizon, sample depth of historical bars, and classifier window size. The indicator requires bar data with volume and outputs visual projections and directional signals. It is designed to offer a probabilistic framework for anticipating price movement based on recent market behavior, suitable for various symbols including BTCUSD, EURUSD, GBPUSD, XAUUSD, NAS100, and others.
カスタマーレビュー
5 | 0 % | |
4 | 100 % | |
3 | 0 % | |
2 | 0 % | |
1 | 0 % |


