説明
📊 Trading Pro Market
https://chartshots.spotware.com/c/69f0ec41d4cfc
トレンドチャネル+価格予測+自動サポート&レジスタンスゾーン — すべてが一つのオーバーレイインジケーターに
🔍 これは何ですか?
https://chartshots.spotware.com/c/69f0ec1fa9930
Trading Pro Marketは、3つの独立したエンジンを1つのツールに統合した高度なテクニカル分析インジケーターです:将来予測付きのトレンドチャネル、過去の動きのパターンに基づく価格予測システム、自動サポート&レジスタンスゾーン検出器。すべて価格チャート上に直接描画され、別のパネルは不要です。
📐 モジュール1 →ICPチャネル🔮 モジュール2 → MFP予測 🧲 モジュール3 → S/Rゾーン
https://chartshots.spotware.com/c/69f0ec8faa957
📐 モジュール1 — トレンドチャネル(ICP)
⚙️ どのようにトレンドを検出しますか?
インジケーターは表示されているバーを時間ブロックに分割します(デフォルト:1ブロックあたり30バー、合計6ブロック)。各ブロック内で、対数価格スケールを使って最高値と最安値の幾何学的中点を計算します。これらの中点をブロック間で結び、価格が上昇トレンド、下降トレンド、または横ばいかを判断します。
その接続線の傾きは角度(度数)に変換されます。角度が設定された閾値(デフォルト0.3°)を下回ると、市場はレンジ相場と分類されます。閾値を超えると、インジケーターは強気または弱気の方向を割り当てます。
💡 ボラティリティはYang-Zhang推定器を使用して測定されます。これは始値、終値、高値、安値を用いて真の市場ボラティリティを計算する統計的な公式です。この数値は角度を正規化し、どの資産や時間枠でもチャネルが一貫して機能するようにします。
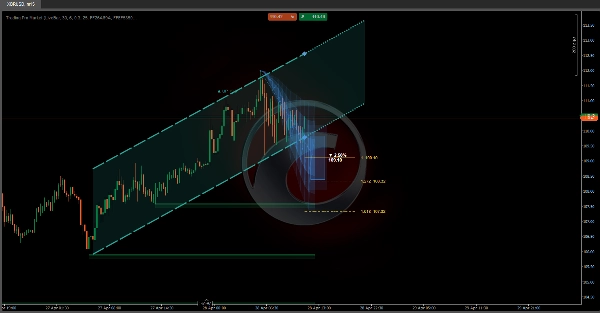
🎨 チャートには何を描きますか?
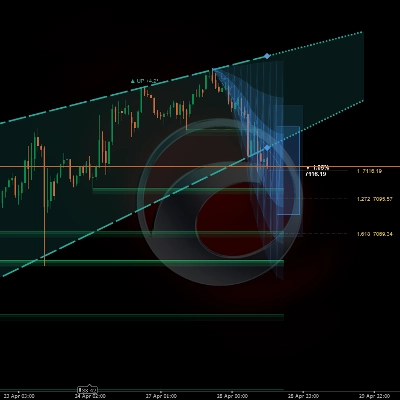
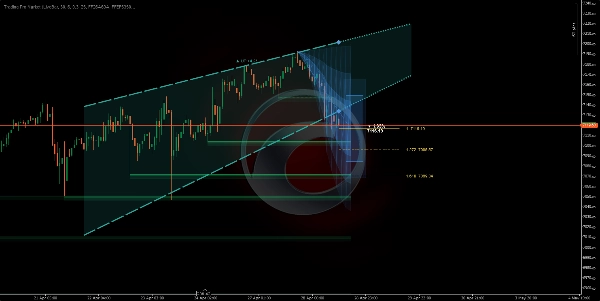
チャネルを形成する2本の線(天井と床)を描き、その間に塗りつぶしゾーンを表示します。右側には現在の傾きに従った点線の予測線が延長されます。色は方向に応じて自動で変わります:
🟢 緑 — 強気トレンド🔴 赤 — 弱気トレンド⬜ 灰色 — レンジ相場
🔁 状態機械 — 価格はチャネル内のどこにありますか?
インジケーターは終値のチャネル境界に対するリアルタイムの位置を追跡し、状況を5つの異なる状態に分類します:
🟦 内部→⚡ ブレイクアウト→📏 距離あり→↩️ 再テスト→✅ 確認済み
各状態はチャートの情報パネルに平易なテキストで説明され、任意の時点でチャネルの天井または床までのパーセンテージ距離も表示されます。
🔮 モジュール2 — 動きの予測(MFP)
⚙️ どのように予測を生成しますか?
エンジンは設定可能なバー数を遡って重要な価格のピボット(局所的な高値と安値)を検出します。各確定ピボットは2つのデータポイントを記録します:完了した価格変動のパーセンテージとそれに要したバー数。最大20の過去の動きを保存し、次の予想動きを3つの方法のいずれかで計算します:
⚖️ 加重 — 最近の動きにより重みを付ける➕ 単純平均 — すべての動きを均等に重み付け📊 中央値 — 外れ値を除外
🎨 チャートには何を描きますか?
現在のピボット起点に基づいて未来に投影される3つのオプションの視覚要素:
1
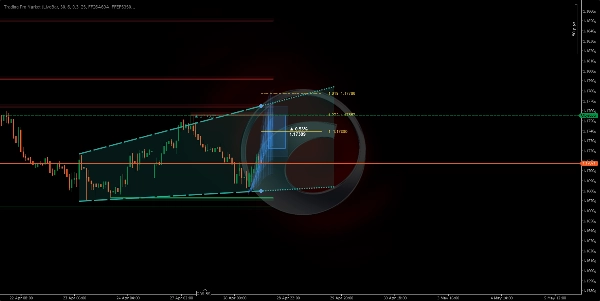
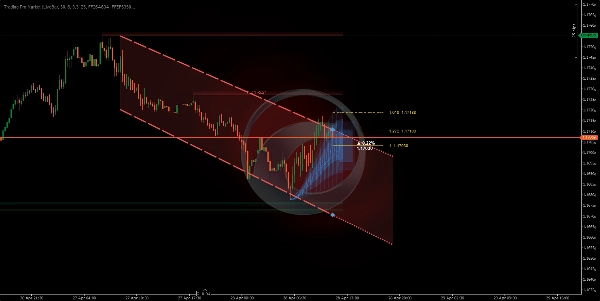
🔵 予測ゾーン: 動きの可能な範囲を示す3層の不透明度が減少するゾーン。広いコーンは過去の分散に基づく不確実性の大きさを意味します。
2
🎯 目標ボックス: 推定到達価格に配置された長方形で、予想されるパーセンテージの動きと正確な価格レベルがテキストで表示されます。
3
📏 フィボナッチレベル: 起点から目的地まで設定可能な比率(デフォルト:1.0、1.272、および 1.618).
⚠️ 予測は未来を予言するものではありません。過去の類似した動きの統計的平均です。その価値は大きさと期間に対する現実的な期待を設定することにあり、単独のエントリーやエグジットのシグナルとしては使いません。
🧲 モジュール3 — サポート&レジスタンスゾーン
⚙️ どのようにゾーンを検出しますか?
ピボットが確定するたびに、インジケーターはATR(平均真の範囲)を使ってゾーンの厚みを決定し、水平ゾーンを描きます。レジスタンスゾーンは赤、サポートゾーンは緑で描かれ、両方とも視覚的な深みと明瞭さを作るために2層の不透明度があります。
ゾーンは動的に振る舞います:価格がゾーンの反対側で終値をつけると「破られた」とマークされ、不透明度が下がった点線に切り替わります。ゾーンは「ゾーン寿命」で設定されたバー数経過後に自動的に消えます。
🚀 使い方
1
トレンドを確認する: チャネルの色と方向をチェックします。角度(度数)はトレンドの強さを示し、角度が急なほど勢いが強いことを意味します。
2
価格の状態を読む: チャートの情報パネルは価格がチャネル内にあるか、ブレイクアウトしているか、またはチャネル境界を再テストしているかをリアルタイムで説明します。
3
予測を評価する: コーンと目標ボックスは、セッション中に蓄積された過去のパターンライブラリに基づき、価格がどこにどれくらい動く可能性があるかの参考を提供します。
4
ゾーンを尊重する: 破られていないS/Rボックスは市場が以前に反応した価格レベルを示します。まだ突破されていないゾーンは、すでに突破されたゾーンよりも重要性が高いです。
🖥️ 互換性&要件
✅ cTrader✅ cAlgo API✅ 任意の資産✅ 任意の時間枠✅ 価格オーバーレイ
インターネットアクセスや特別な権限は不要です。すべての計算はプラットフォームで既に利用可能な価格データを使ってローカルで実行されます。
⏱️ 最良の結果を得るには、15分以上の時間枠で使用してください。非常に短い時間枠(1〜5分)では、市場ノイズにより統計的信頼性の低いピボットが生成され、S/Rゾーンと予測の品質が低下します。
概要
カスタマーレビュー
5 | 0 % | |
4 | 100 % | |
3 | 0 % | |
2 | 0 % | |
1 | 0 % |


