

Beschreibung
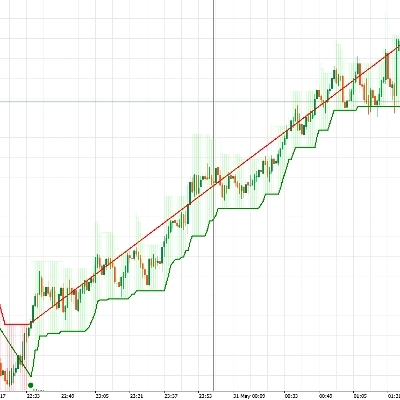
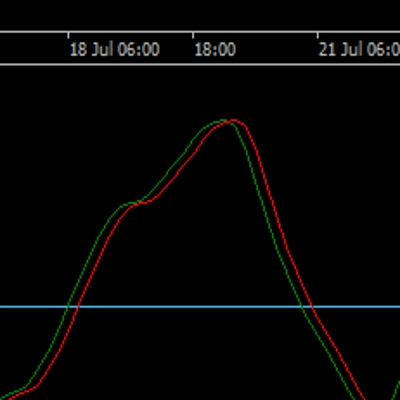
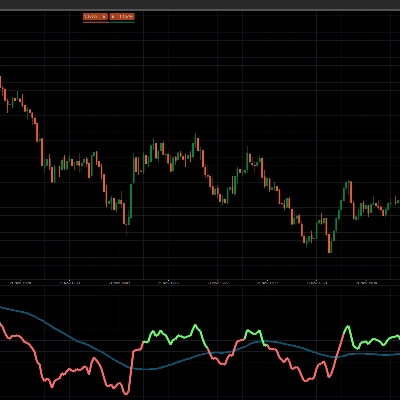
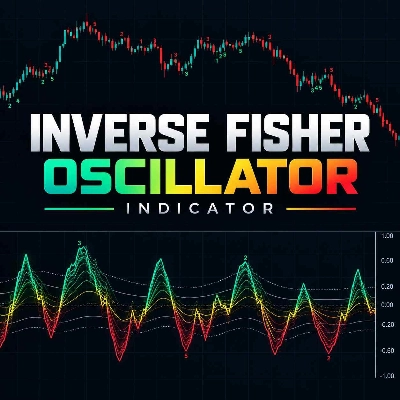
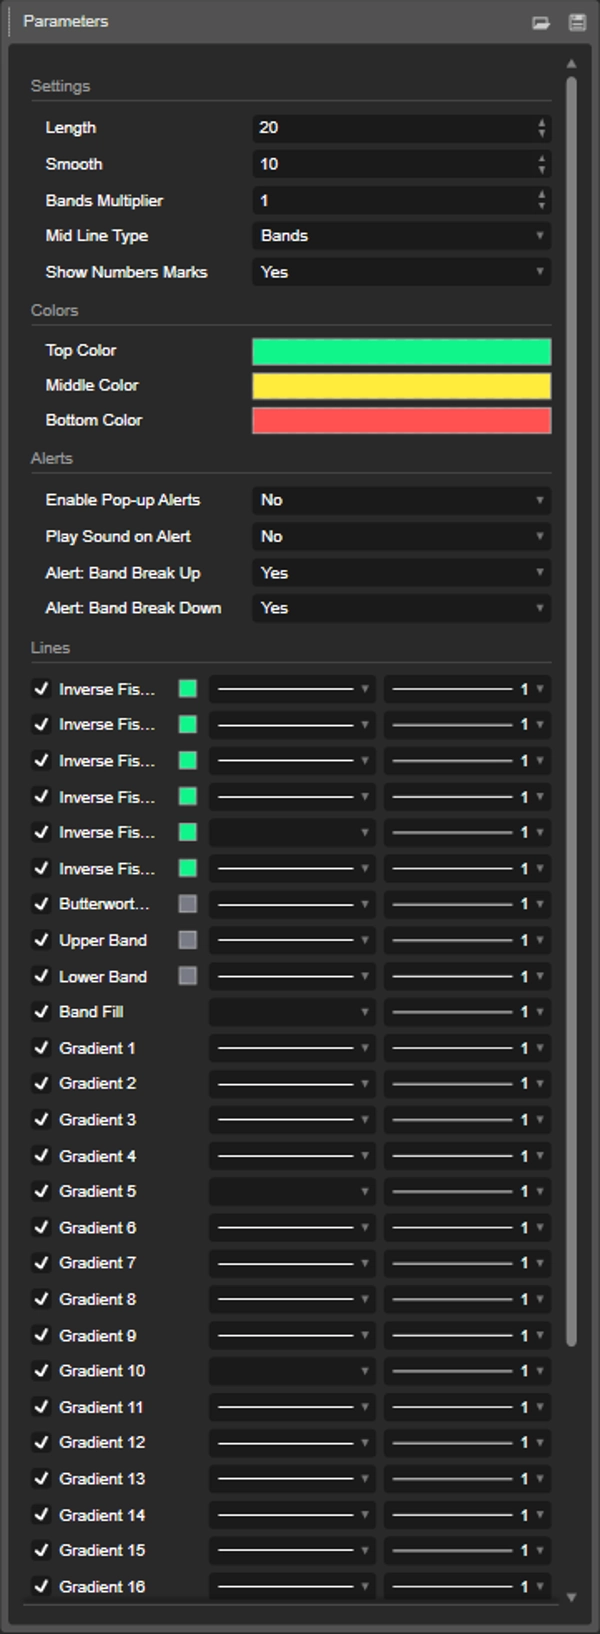
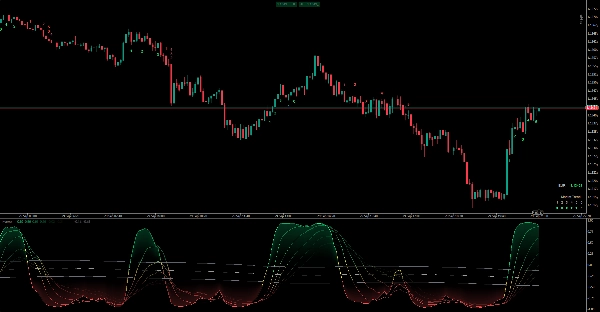
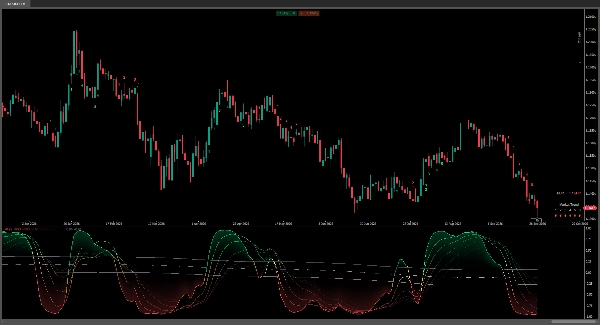
Inverse Fisher Oscillator - Indicator Running six separate oscillators means six settings panels and six places to look. This puts all six smoothing speeds into a single pane below the price chart, wraps them in volatility bands that widen and tighten with the market, and prints a digit on the candle for each crossing, naming the smoothing speed that broke the band. Three things worth knowing before you read on: - Alerts fire on closed candles only, so an announced band break is never revised. - Nothing pops and nothing plays until you switch an alert channel on. A fresh install is silent. - It needs history. Expect about 430 candles of warm-up before the bands, shading, marks and alerts appear, and roughly 29 to 79 before the six lines do. HOW IT WORKS One attachment instead of six. Lines 1-6 are weighted moving averages of normalised price at lengths Smooth x 1 through Smooth x 6, each passed through the Inverse Fisher Transform, which maps the result into a fixed -1 to +1 range. The lines fade progressively, so the fastest reads strongest and the slowest recedes, and the gap between the two tells you how stretched the move is. Bands that follow the market. The upper and lower bands sit a 400-bar average of line 1's absolute two-bar change, scaled by Bands Multiplier, above and below the mid line. They widen in turbulent conditions and tighten in quiet ones, so one rule keeps working across regimes. A mid line built from a two-pole low-pass filter, applied to line 1 with a 500-bar cutoff and drawn on every fifth bar in your chart's own foreground colour, so it stays a background reference rather than a level that stops the eye. It is the filter's trend, not support or resistance. No volume required. The indicator reads price data only - opens, highs, lows and closes - so it also works on symbols where your broker supplies no volume data. WHAT YOU SEE ON THE CHART A digit on the candle that tells you which horizon fired. Under the candle is an upward band break, above it a downward one, and the number is the smoothing speed that triggered it: 1 fastest, 5 slowest. Line 6 is the slowest of all and is never marked. Mark positions are recalculated on every zoom, scroll and resize. A gradient that measures the excursion. Twenty-four slices step from roughly nothing at the band edge to about a fifth of full opacity at the curve, green above the band and red below. A cTrader cloud carries a single flat opacity, so the ramp is rebuilt from 24 stacked slices instead of one flat cloud. Those 24 slices show up in the indicator legend, where cTrader offers no way to hide them; the cloud attributes doing the painting add no entries. A Market Trend dashboard in the corner of the chart: the base asset as your broker names it, the live price coloured by the direction of the candle, and an arrow for each of the six lines - up above the upper band, down below the lower band, dash in between. How to read it: - Green above the upper band, yellow between the bands, red below the lower band. Top Color, Middle Color and Bottom Color are inputs, and they drive the six lines, the digits, the dashboard arrows and the dashboard's price figure. The bands keep their own grey, which you can still change in the line's settings. The shading keeps a fixed green and red and is not affected by any of them. - Shading appears only while line 1 is outside the bands. It stops a short way in from the band rather than reaching it, so the paint begins just inside the band edge and is strongest at the curve. - The mid line is trend, not a level. In Simple mid line mode it is pinned to zero and both bands are hidden, so every crossing becomes a crossing of the zero line. SETTINGS Settings: Length 20, Smooth 10, Bands Multiplier 1, Mid Line Type (Bands or Simple), Show Numbers Marks on. Colors: Top Color, Middle Color, Bottom Color. Alerts: Enable Pop-up Alerts off, Play Sound on Alert off, Alert: Band Break Up on, Alert: Band Break Down on. The shading, the bands and the dashboard keep a fixed design and carry no switches. A short welcome message is written to the cTrader log on load. ALERTS - Enable Pop-up Alerts and Play Sound on Alert are independent of each other and both ship off. Nothing pops and nothing plays until you enable a channel. - Alert: Band Break Up and Alert: Band Break Down control each direction separately and ship on, so enabling a single channel is all it takes. - Alerts fire on closed candles only, when one of the first five oscillators crosses a band against the previous candle. Several crossings on one candle fold into a single notification per direction, naming the digits that crossed, so five lines breaking together produce one message rather than five. The digits drawn on a candle still settling are provisional and are final once it closes. - History reloads, index rollbacks and recalculated closed candles are deduplicated by candle time, so the same break is never announced twice. - Each notification names the direction, the crossed digits, the symbol, the timeframe and the bar time as cTrader reports it. A break up uses the positive sound, a break down the negative one. - Show Numbers Marks controls only the drawing of the digits. It does not mute alerts. BEST ON Runs on Forex, indices, commodities, crypto and equities - anything your broker supplies OHLC data for. Recommended timeframe: H1 and higher. The design is deliberately slow, so allow for the warm-up above. Two internal constants are fixed: the 400-bar volatility window behind the bands and the 500-bar cutoff behind the mid line. If the chart opens empty, load more history once - after that, values match a chart carrying years of data. Trading use cases: - Trend trades: trade with the side of the mid line, and use the bands to confirm that a move is extended rather than chased. - Mean-reversion entries: a band break followed by the fast lines turning back inside the bands is the classic exhaustion read, and the digit tells you which speed rejected the move. - Confirming breakouts: the shading measures how far the oscillator left the band before the filter caught up with it. - Multi-speed divergence: the fastest line above the upper band while the slowest is still inside means momentum is fading faster than the slow average can follow. - Staying off the chart: leave the indicator on a screen you do not stare at and let the alerts tell you that a band break happened. AUTOMATION AND DATA SERIES Every output is a public data series, so a cBot or an external tool can read the six oscillators, the mid line, both bands, the band-fill line and the gradient levels. The band-fill line and the gradient levels are blank whenever line 1 is inside the bands, and both bands are blank in Simple mid line mode. The indicator places no orders and makes no predictions. A visual tool for analysis only. It doesn't place trades and isn't investment advice.