present
سجل واحصل على خصم 50 دولارًا على مشترياتك الأولى
Trading product for RSI reversal MTF مؤشر Aggressive RSI, image 1
RSI reversal MTF
مؤشر
الإصدار 1.0، May 2026
Windows, Mac
Trading product for RSI reversal MTF مؤشر Aggressive RSI, image 2
Trading product for RSI reversal MTF مؤشر Aggressive RSI, image 3
Trading product for RSI reversal MTF مؤشر Aggressive RSI, image 4
Trading product for RSI reversal MTF مؤشر Aggressive RSI, image 5
86
المبيعات
1.19K
التثبيتات المجانية

الوصف

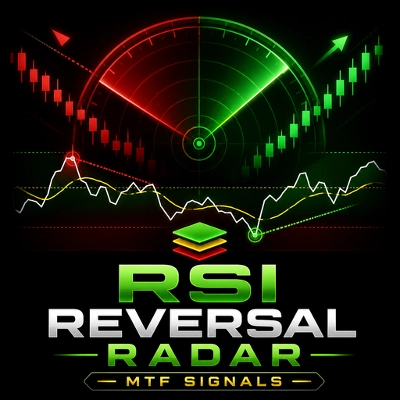
RSI Reversal Radar MTF Signals

This indicator allows scalpers to select up to 4 different MTF timeframes, including the 1-minute timeframe.
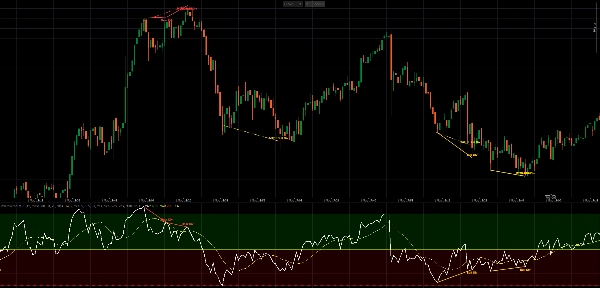
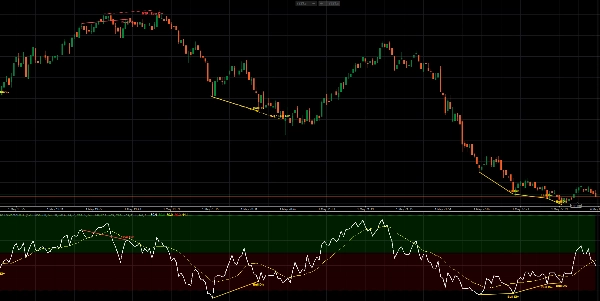
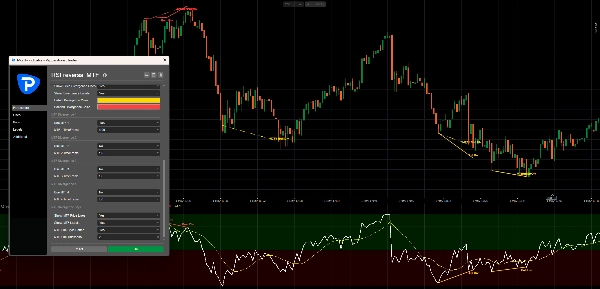
The selected MTF bullish or bearish divergence lines are drawn extra on the main price chart, giving scalpers additional potential reversal signals on top of the normal divergence from the current chart timeframe.

The RSI subwindow always stays based on your current chart timeframe.


Description

RSI Reversal Radar MTF Signals is an RSI-based cTrader indicator designed especially for traders who want to spot potential reversal signals across multiple timeframes.

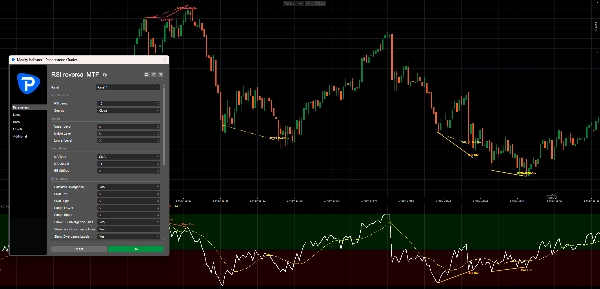
It includes a classic RSI panel with upper, middle, and lower levels, optional RSI smoothing, Bollinger Bands, cloud zones, and automatic bullish and bearish divergence detection.

The main feature is the multi-timeframe divergence system. You can enable up to 4 separate MTF slots, each with its own timeframe, such as:

1 Minute
5 Minute
15 Minute
1 Hour

These selected MTF bullish and bearish divergence signals are drawn directly on the main price chart as extra reversal lines. This makes the indicator useful for scalpers who want to see lower-timeframe and higher-timeframe reversal pressure together on one chart.


How It Works

The indicator first calculates the RSI on your current chart timeframe.

For example, if you are trading on a 1-minute chart, the RSI subwindow remains based on the 1-minute chart data. The normal divergence system detects current-timeframe bullish and bearish divergence and draws those signals in the RSI window and on the main chart.

The divergence logic is:

Bullish divergence:
Price makes a lower low,
while RSI makes a higher low.

Bearish divergence:
Price makes a higher high,
while RSI makes a lower high.

When MTF divergence is enabled, RSI Reversal Radar MTF Signals also checks your selected additional timeframes separately. Each selected timeframe calculates its own RSI and detects its own bullish or bearish divergence.

Those MTF signals are then drawn only on the main price chart as extra bullish or bearish reversal lines.

This means the RSI subwindow does not change when you select MTF timeframes. It stays clean and based on your current chart, while the main chart receives extra reversal signals from the selected timeframes.


Example Scalping Setup

A scalper could use:

Chart timeframe: 1 Minute

MTF 1: 1 Minute
MTF 2: 5 Minute
MTF 3: 15 Minute
MTF 4: 1 Hour

The main chart can then show:

Current chart divergence
+ extra 1-minute MTF divergence
+ extra 5-minute MTF divergence
+ extra 15-minute MTF divergence
+ extra 1-hour MTF divergence

This helps scalpers see when fast 1-minute reversal signals align with stronger signals from higher timeframes.


Key Features

  • Built for scalpers and multi-timeframe traders
  • Supports up to 4 selectable MTF divergence timeframes
  • Includes 1-minute MTF support for fast scalping signals
  • MTF bullish and bearish divergence lines are added extra on the main chart
  • RSI subwindow stays based on the current chart timeframe
  • RSI levels: 80, 50, and 20
  • Green and red RSI cloud zones
  • Optional RSI smoothing MA
  • Supports SMA, EMA, SMMA/RMA, WMA, VWMA
  • Optional SMA Bollinger Bands on RSI
  • Automatic regular bullish divergence
  • Automatic regular bearish divergence
  • Normal divergence lines in the RSI subwindow
  • Normal divergence lines on the main price chart
  • Optional dotted or solid MTF line style
  • Customizable MTF line thickness
  • Optional labels for normal and MTF divergence signals


Practical Use

Bullish divergence can suggest that selling pressure may be weakening and that price could be preparing for an upward reversal.

Bearish divergence can suggest that buying pressure may be weakening and that price could be preparing for a downward reversal.

For scalpers, the most interesting areas are often where fast signals and higher-timeframe signals appear close together. For example, a 1-minute bullish divergence near a 5-minute or 15-minute bullish divergence may highlight a stronger potential reversal zone.

These signals are not meant to be used alone. They are best combined with market structure, support and resistance, trendlines, volume, or your own entry confirmation.
الملخص

ملف تعريف المؤشر
فئة المؤشر
الزخم
نوع المخرجات
الإشارات
فلتر
التصور
متطلبات البيانات
أعمدة السعر فقط
الحجم
البيانات الخارجية
الإشارات المدعومة
التباين
الانقطاع
الانعكاس
قوة الاتجاه

مناقشة

تقييمات العملاء

0.0
التقييمات: 0
تقييمات العملاء
لا توجد تقييمات لهذا المنتج حتى الآن. هل جرَّبته بالفعل؟ كن أول من يخبر الآخرين!

الأسئلة الشائعة

Aggressive
RSI
يتم توفير المنتجات المتاحة من خلال cTrader Store، بما في ذلك روبوتات التداول والمؤشرات والإضافات، من قبل مطوري الطرف الثالث وإتاحتها لأغراض الوصول المعلوماتي والفني فقط. cTrader Store ليس وسيطًا ولا يقدم نصائح استثمارية أو توصيات شخصية أو أي ضمان للأداء المستقبلي.

المزيد من هذا المؤلف

مؤشر
AI
ATR
+27
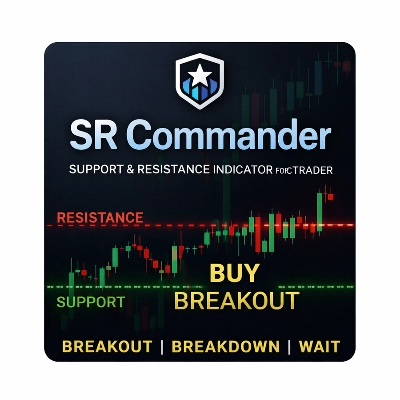
SR Commander is a clean and intelligent support and resistance indicator for cTrader, built to help traders identify key
مؤشر
AI
ATR
+20
Buy and Sell Signals
مؤشر
AI
ATR
+27
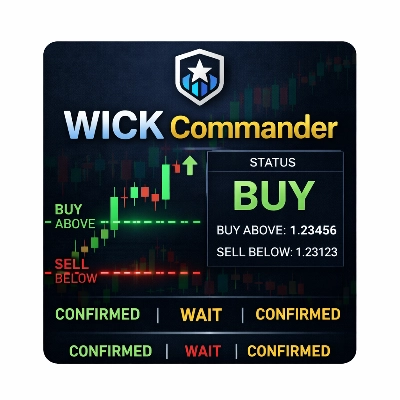
WICK COMMANDER — Know Exactly When the Market Commits
مؤشر
AI
ATR
+27
Overbought Oversold Indicator
مؤشر
AI
ATR
+20
Know Sure Thing (KST) momentum engine
مؤشر
AI
SMC
+5
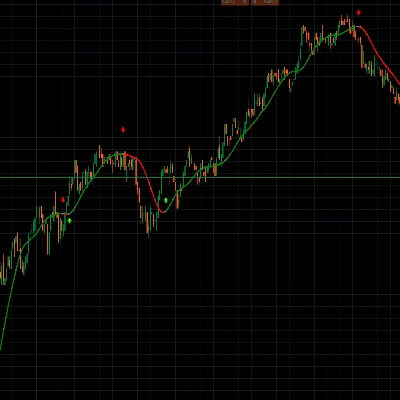
Coloring trendline/ Colored Trendline / Color Trendline
مؤشر
AI
ATR
+27
VWAP Sniper Elite -- Institutional Trend Engine
مؤشر
AI
SMC
+13
Dynamic Liquidity Depth exposes hidden volume
مؤشر
AI
ATR
+26
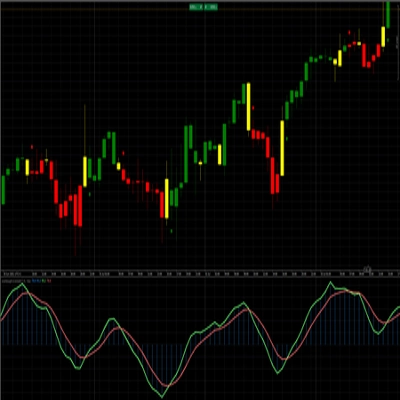
Entry Momentum MACD Power Guide
مؤشر
AI
ATR
+27
The Professional “All-in-One” Trading Suite (buy and sell indicator)
مؤشر
AI
ATR
+26
SR Commander — Multi Timeframe Edition. See where the big money draws the line. Trade on your timeframe. Think on theirs
شعار "crossover 1"
الأعلى تقييمًا
4.2
(5)
$19
/
$29
مؤشر
AI
Grid
+10
Crossover Buy and Sell Alerts and signals

قد يعجبك أيضًا

مؤشر
ATR
EMA
+5
Candle timer with live profit tracking on chart – displays pips, currency value, and percentage in real time.
مؤشر
MACD
Forex
+2
a revolutionary indicator that integrates volume into MACD.
مؤشر
EMA
RSI
+4
🚀📈 Plot buy/sell signals on Range Bars using Moving Averages and RSI. Clear, actionable trading insights.🚀📈
مؤشر
MultiTF Pivot and SR Indicator
مؤشر
ATR
Key Levels
+1
Explore 88 harmonic price-pattern variants with interactive chart controls and geometric reference levels.
مؤشر
EMA
AI-assisted
+1
Multi EMA Timeframes lets you stay on your chart and see the exact EMA from any timeframe you choose — up to 5 at once.
مؤشر
ATR
MSS
+3
Stop drawing levels manually. SmartLevels Pro detects, scores & predicts — H4/H1/M15 · cTrader
مؤشر
AI
Grid
+17
Clean 3D, Sleek Candles for Trend Patterns.
مؤشر
Boost your trading with Candlestick Patterns for cTrader – auto-detect key signals for smarter, faster decisions!
مؤشر
RSI
Forex
+4
😎Read the description before purchasing💩
مؤشر
Forex
BTCUSD
+9
This indicator implements an Opening Range Breakout (ORB) trading strategy, designed to capture momentum during the most
مؤشر
BOS
EMA
+5
VWAP Bands indicator with 3 standard deviation levels, buy/sell zones, and a draggable ON/OFF button to toggle the entir
شعار "ZigZag Structure Pro"
الأعلى تقييمًا
4.2
(4)
$19
/
$20
مؤشر
Forex
BTCUSD
+12
🎯Automatically identifies the market's significant turning points (key H & L) and draws dynamic support and.....✍️
مؤشر
Prop
Forex
+9
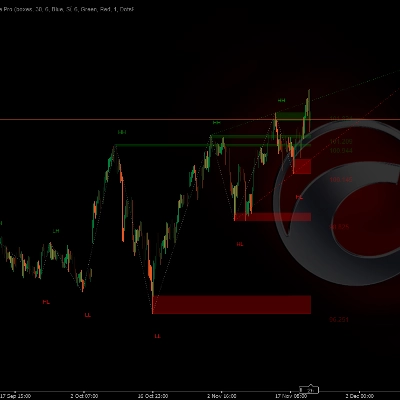
Trend Sniper — session-based tool highlighting live session ranges and adaptive Custom line.
مؤشر
AI
ATR
+27
VolumeProfileSuite is an advanced and flexible Volume Profile indicator for cTrader.
مؤشر
ATR
VWAP
+4
Structure-aware indicator that re-anchors VWAP to confirmed swing pivots.
شعار "[Stellar Strategies] VBO"
الأعلى تقييمًا
4.8
(5)
$19
/
$29
مؤشر
Forex
BTCUSD
+11
Next-gen Volume Oscillator using Hyperbolic Tangent math. No repainting. Includes arrows, alerts, and overlay mode 🎯
مؤشر
Risk Dashboard
AI-powered daily range forecasts help traders spot volatility opportunities and plan stops and targets.

السعر

86
المبيعات
1.19K
التثبيتات المجانية