Penerangan
Kenal pasti zon MINAT INSTITUSI YANG TINGGI: Di mana terdapat VOLUME LEBIH BANYAK dalam pecahan, terdapat PENGLIBATAN LEBIH BESAR daripada PEMAIN BESAR.
• ⚖️ Ukur KESEIMBANGAN KUASA: Lihat sama ada TEKANAN BELIAN atau PENJUALAN mendominasi dalam setiap zon harga
• 🎯 Kenal pasti TAHAP UTAMA: Zon dengan VOLUME PECAHAN YANG LEBIH TINGGI selalunya bertindak sebagai SOKONGAN/PEMBANTUTAN MASA HADAPAN
• ✅ Sahkan pergerakan: Satu PECAHAN dengan VOLUME TINGGI mempunyai KEMUNGKINAN LEBIH TINGGI untuk menjadi tulen
https://chartshots.spotware.com/c/6941a3f65f376
📈 BAGAIMANA UNTUK MEMBACA?
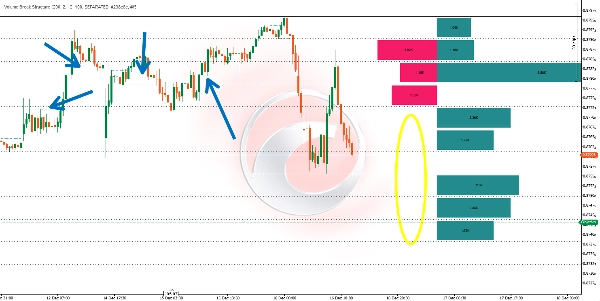
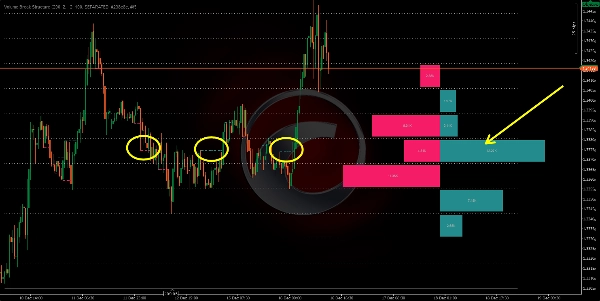
📊 Garis Mendatar
• Setiap garis menandakan tahap di mana PECAHAN STRUKTUR berlaku
• 🟢 PECAHAN BULLISH
• 🔴 PECAHAN BEARISH
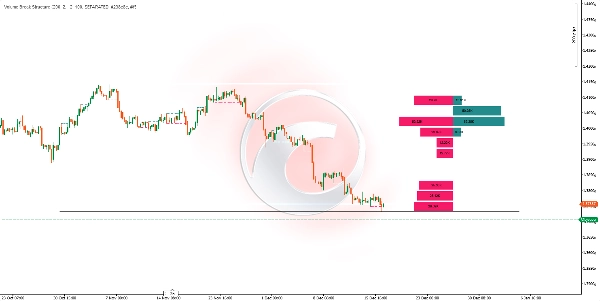
📈 Histogram
• Terletak di SEBELAH KANAN GRAF
• Dibahagikan kepada BARIS mewakili JULAT HARGA YANG SAMA
• 📗 Bar TEKANAN PEMBELI: VOLUME TERKUMPUL pecahan bullish dalam zon itu
• 📕 Bar TEKANAN PENJUAL: VOLUME TERKUMPUL pecahan bearish dalam zon itu
• ⬆️ Saiz Bar: Saiz LEBIH BESAR menunjukkan VOLUME LEBIH BESAR pecahan pada tahap itu
https://chartshots.spotware.com/c/6941a4346ede0
🟦 Grid
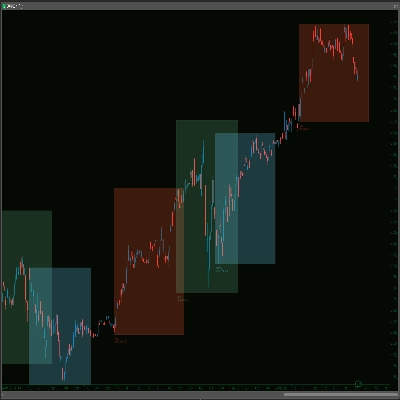
• Garis atas dan bawah yang PEKAT menandakan JANGKA MAKSIMUM dan MINIMUM tempoh yang dianalisis
• Garis BERTITIK membahagikan jangka itu kepada SEKSYEN YANG SAMA untuk bacaan yang lebih mudah
⚙️ 🔧 PARAMETER UTAMA
ParameterFungsi
🕯️ Bar Pengiraan
Bilangan lilin yang dianalisis KE BELAKANG
🎚️ Panjang Ayunan
KEPEKAAN untuk mengesan pivot (LEBIH TINGGI = isyarat lebih sedikit, LEBIH BOLEH DIPERCAYAI)
📊 Baris Histogram
Bilangan PEMBAHAGIAN/BARIS dalam histogram
📏 Lebar Histogram
LEBAR VISUAL histogram
👁️ Mod Paparan
BERASINGAN (beli/jual) atau TERKUMPUL (jumlah volume)
🔄 BILA IA DIKEMAS KINI?
🕒 Penunjuk MENGIRA SEMULA SECARA AUTOMATIK pada PENUTUPAN setiap lilin, memasukkan sebarang PECAHAN STRUKTUR BARU yang telah berlaku.
💡 🤝 BAGAIMANA UNTUK MENGGABUNGKANNYA?
📈 Dengan ANALISIS TREND
• Dalam TREND MENINGKAT, cari zon di mana VOLUME TEKANAN BELIAN MENDOMINASI untuk potensi kemasukan pada PENARIKAN BALIK
• Dalam TREND MENURUN, cari zon di mana VOLUME TEKANAN PENJUAL MENDOMINASI untuk potensi kemasukan pada PANTULAN
🛡️ Dengan SOKONGAN dan RINTANGAN
• Tahap dengan VOLUME PECAHAN TERTINGGI selalunya menjadi ZON REAKSI MASA HADAPAN
• Gunakan histogram untuk mengenal pasti zon yang paling "DIPERTAHANKAN" oleh pembeli atau penjual
🌊 Dengan ALIRAN PESANAN
• SAHKAN bacaan histogram dengan ALIRAN PESANAN MASA NYATA alat
• Zon volume pecahan tinggi selalunya bertepatan dengan KAWASAN PENYERAPAN INSTITUSI
🕯️ Dengan TINDAKAN HARGA
• Cari CORAK LILIN di zon di mana histogram menunjukkan KETIDAKSEIMBANGAN YANG KETARA
• Satu CORAK PEMBALIKAN di zon TEKANAN BELIAN YANG TINGGI mempunyai KEMUNGKINAN KEJAYAAN YANG LEBIH TINGGI
🎯 🚀 PENAFSIRAN PANTAS
Isyarat VisualPenafsiran
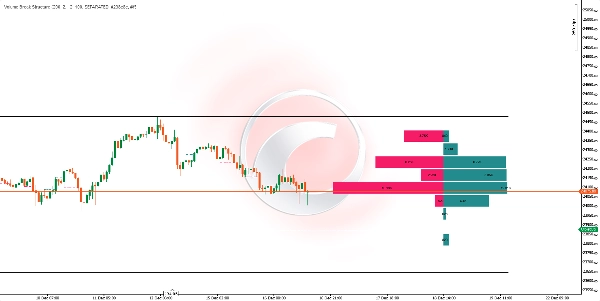
📗 Bar PEMBELI besar, 📕 bar penjual kecil
ZON PERMINTAAN KUAT, kemungkinan SOKONGAN
📕 Bar PENJUAL besar, 📗 bar pembeli kecil
ZON PEMBEKALAN KUAT, kemungkinan RINTANGAN
⚔️ Kedua-dua bar BESAR dan serupa
ZON PERTEMPURAN, VOLATILITI TINGGI dijangka
⏭️ Baris tanpa BAR
ZON MINAT RENDAH, harga melaluinya dengan PANTAS
PERTIMBANGAN PENTING
• ❌ Penunjuk BERFUNGSI DENGAN DATA SEJARAH YANG DISESAHKAN; IA TIDAK MERAMALKAN MASA HADAPAN
• 📊 BILANGAN BAR PENGIRAAN LEBIH TINGGI = PANDANGAN LEBIH LUAS tetapi boleh MENIPISKAN ISYARAT TERKINI
• ⏰ SESUAIKAN Panjang Ayunan mengikut RANGKAIAN MASA: NILAI LEBIH TINGGI untuk RANGKAIAN MASA LEBIH TINGGI
• 🛡️ SENTIASA GABUNGKAN dengan PENGURUSAN RISIKO YANG BETUL
Ringkasan
Key features include:
- Horizontal lines marking bullish (green) and bearish (red) structure breaks.
- A histogram on the right side of the chart divided into rows representing equal price ranges, showing accumulated volume of bullish and bearish breaks. Larger bars indicate higher volume.
- A grid marking the maximum and minimum price range of the analyzed period, divided into equal sections for easier reading.
The indicator recalculates automatically at the close of each candle, updating with any new structure breaks. Main adjustable parameters include the number of bars analyzed backward, swing length sensitivity for pivot detection, histogram rows, histogram width, and display mode (separated buy/sell or aggregated volume).
Volume Break Structure can be combined with trend analysis, support and resistance levels, order flow tools, and price action patterns to confirm market movements and identify potential entry points. It works with confirmed historical data and does not predict future price action.
Ulasan pelanggan
5 | 0 % | |
4 | 100 % | |
3 | 0 % | |
2 | 0 % | |
1 | 0 % |