Açıklama
📊 VPOC MONTE CARLO BEKLENEN DEĞERİ
https://chartshots.spotware.com/c/69c558e2c68df
Entegre Piyasa Analizi: Hacim Profili + İstatistiksel Projeksiyon 🎯
🎯 BU NEDİR?
VPOC Monte Carlo Beklenen Değeri, iki profesyonel ticaret metodolojisini birleştiren nicel bir analiz göstergesidir:
- Piyasa Derinliği Profili (VPOC) - Hacmin gerçekten yoğunlaştığı yerleri belirler 🏦
- Monte Carlo Simülasyonu - İstatistiksel olasılıklara dayalı gelecekteki senaryoları projekte eder 📈
Sonuç, paranın nerede olduğunu (Kontrol Noktası) ve nereye gitme olasılığının yüksek olduğunu (projeksiyon Beklenen Değer) söyleyen bir analiz sistemidir 🧠
⚙️ NASIL ÇALIŞIR?
Modül 1: Derinlik Profili (VPOC) 📊
Gösterge son 200 barı (ayar yapılabilir) analiz eder ve hacmi 30 fiyat seviyesine dağıtır. Şunları hesaplar:
- Kontrol Noktası (PoC): En yüksek işlem hacmine sahip fiyat - alıcılar ve satıcıların en aktif olduğu piyasa uzlaşısını temsil eder ⚖️
- Delta: Her seviyedeki alım ve satım baskısı arasındaki fark 🔄
- Isı Haritası: Aktivite yoğunluğunun görselleştirilmesi 🔥
Mantık: Fiyat genellikle PoC'ye geri döner çünkü en çok bekleyen likidite orada bulunur. Fiyat PoC'den uzaksa, geri dönüş olasılığı daha yüksektir 🔄
Modül 2: İstatistiksel Projeksiyon (Monte Carlo) 🎲
Gelecekteki fiyatı projekte etmek için stokastik simülasyonlar kullanır (varsayılan olarak 1.000 iterasyon):
- Varlığın tarihsel trendini ve yıllık volatilitesini hesaplar 📉📈
- Normal dağılım kullanarak rastgele yollar üretir (geometrik Brown hareket modeli) 🌊
- Beklenen Değeri standart sapma bantlarıyla (±1 sigma) tahmin eder 📏
Uygulanan formül: - Bar başına sürüklenme = Yıllık getiri / işlem günleri 🧮
- Bar başına volatilite = Yıllık volatilite / √günler ⚡
- Projeksiyon = Güncel fiyat × e^(toplam sürüklenme + normal rastgele × toplam volatilite) 🔢
Modül 3: Sinerji 🔗
Her iki analizi birleştirerek bağlamsal sinyaller üretir:
Tablo
Sinyal Koşulu Anlamı
BOĞA ↑ 🟢 Fiyat > PoC + Pozitif projeksiyon Hacimle doğrulanmış boğa trendi
AYAĞI ↓ 🔴 Fiyat < PoC + Negatif projeksiyon Hacimle doğrulanmış ayı trendi
FIRSAT ★ 💡 Fiyat < PoC + Pozitif projeksiyon Hacim desteğinden olası sıçrama
UYUMSUZLUK ⚠️ ⚠️ Fiyat > PoC + Negatif projeksiyon Olası dönüş uyarısı
📈 NE İÇİN KULLANILIR?
✅ Ana hacim seviyelerini belirlemek - PoC fiyat mıknatısı görevi görür 🧲
✅ Başarı olasılıklarını tahmin etmek - Simülasyondaki kazanma senaryolarının yüzdesi 🏆
✅ Risk/ödül değerlendirmesi yapmak - Projeksiyon Sharpe oranı ve standart sapma 📊
✅ İşlem yönünü onaylamak - PoC'ye göre pozisyon ve istatistiksel momentum arasındaki sinerji 🎯
✅ Hedef projeksiyonu - Tanımlı tutma dönemi için beklenen fiyat seviyeleri 🎯
🎮 KONFİGÜRASYON VE KULLANIM
Ana Parametreler:
Tablo
Grup Parametre Varsayılan Açıklama
Derinlik Profili Analiz Süresi 200 bar Hacim profilini hesaplamak için geçmiş
Fiyat Seviyeleri 30 Profil çözünürlüğü (daha fazla seviye = daha fazla detay) 🔍
Yatay Ofset 5 Grafikte profil pozisyonu 📏
İstatistiksel Projeksiyon Maks İşlem Süresi 252 bar Projeksiyonun zaman ufku ⏱️
Yatırılan Sermaye $1,000 Parasal hesaplamalar için temel 💰
Simülasyonlar 1,000 Rastgele yolların sayısı (daha fazla = daha doğru, daha yavaş) 🔄
Risksiz Getiri Oranı %5 Sharpe Oranı hesaplaması için 📉
Tarihsel Strateji TP/SL Kullanımı Hayır Sabit hedeflerle simülasyon yapmak için etkinleştir 🎯
Sonuçları Yorumlama Tablosu:
düz
Kopyala
BEKLENEN DEĞER İSTATİSTİKLERİ
┌──────────────┬─────────┬─────────┬─────────┬────────┐
│ Yöntem │ $ Tutar│ % Getiri│ Kazanma Oranı│ Sharpe │
├──────────────┼─────────┼─────────┼─────────┼────────┤
│ Tarihsel │ -$19.56 │ -1.96% │ %47.2 │ -1.24 │
│ Simülasyon │ -$54.05 │ -5.40% │ %21.4 │ -4.95 │
└──────────────┴─────────┴─────────┴─────────┴────────┘
- Tarihsel: Benzer geçmiş işlemlerin ortalama performansı 📜
- Simülasyon: 1.000 Monte Carlo simülasyonunun ortalama sonucu 🎲
- Kazanma Oranı: Pozitif sonuçlu senaryoların yüzdesi ✅
- Sharpe: Risk ayarlı getiri (1'den büyük iyi, negatif kötü) 📈
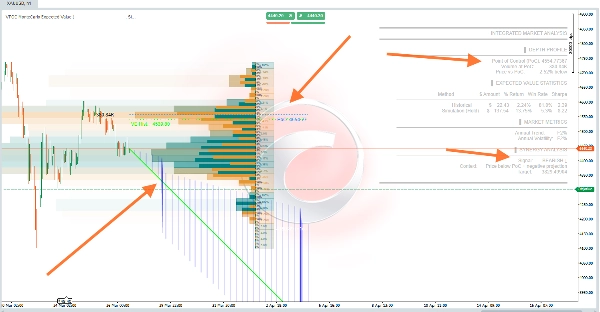
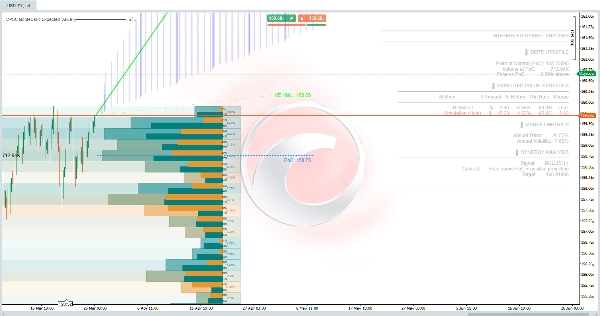
🖼️ Grafikte Görsel Öğeler
Tablo
Öğe Renk Anlam
Hacim profili Turuncu/mavi gradyan Fiyat seviyesine göre aktivite yoğunluğu 🎨
PoC çizgisi Mavi noktalı Geleceğe projekte edilmiş Kontrol Noktası 🔵
EV projeksiyon çizgisi Yeşil/Mor Beklenen fiyat trajektorisi 🟢🔴
±1σ bandı Beyaz noktalı çizgiler %68 güven aralığı 📊
Tarihsel EV çizgisi Yeşil noktalı Tarihsel verilere dayalı beklenen değer 🟢
Projeksiyon bölgesi Saydam mavi dolgu Bantlar arasındaki olasılık alanı 🔵
⚠️ ÖNEMLİ - Sınırlamalar
- Al/Sat sinyali değildir - Olasılıksal bir analiz aracıdır 🛠️
- Monte Carlo simülasyonları tarihsel dağılımın geçerli olduğunu varsayar (kara kuğu olaylarını tahmin etmez) 🦢❌
- PoC dinamiktir - Her yeni barda yeniden hesaplanır 🔄
- Yeterli geçmiş gerektirir - Güvenilir projeksiyonlar için minimum 252 bar 📊
- Kripto paralar - Gösterge otomatik olarak 365 yıllık işlem gününe ayarlanır, geleneksel piyasalar için 252 yerine 🪙
💡 Önerilen Kullanım Stratejisi
- FIRSAT ★ 💡 Ara - Fiyat PoC'nin altında ama pozitif projeksiyon var (olası düşük değerleme)
- Kazanma Oranı > %50 ile onayla - Daha yüksek istatistiksel başarı olasılığı ✅
- UYUMSUZLUK ⚠️ ⚠️'dan kaçın - Gerçek hacme göre aşırı değerlenmiş fiyat
- Referans olarak PoC'yi kullan - Bu likidite seviyesi etrafında durdurma veya hedefler 🎯
- Tarihsel ile Simülasyonu karşılaştır - Çok farklılarsa piyasa rejimi değişiyor demektir 🔄
Özet
Using Monte Carlo simulations with default 1,000 iterations, it projects future price scenarios based on historical trends and volatility, applying a geometric Brownian motion model. This generates expected price trajectories with confidence bands (±1 standard deviation), estimating probabilities of success, risk-adjusted returns (Sharpe ratio), and potential target levels.
The combined analysis produces contextual signals such as Bullish, Bearish, Opportunity, and Divergence, based on price relation to PoC and projection direction. It supports various markets including Forex, stocks, commodities, indices, and cryptocurrencies, adjusting parameters like trading days accordingly.
Key configurable settings include analysis period, profile resolution, simulation count, and risk-free rate. Visual elements on the chart display volume profiles, PoC lines, expected value projections, and confidence intervals. The tool is designed for probabilistic market assessment and trade confirmation rather than direct buy/sell signals.