
Volume & Session Indicators
Find volume and session indicators that help you see when the market is active and where liquidity tends to appear. These indicators and chart tools can mark session opens, overlaps, and volume shifts directly on the chart, supporting timing-focused trading strategy decisions. Great for intraday trading on Forex, XAUUSD, NAS100, and DAX.
Tools
Tool comparison
FAQ























Tool comparison
Product | Reviews | Downloads | Sales | Price | Compatible platforms |
|---|---|---|---|---|---|
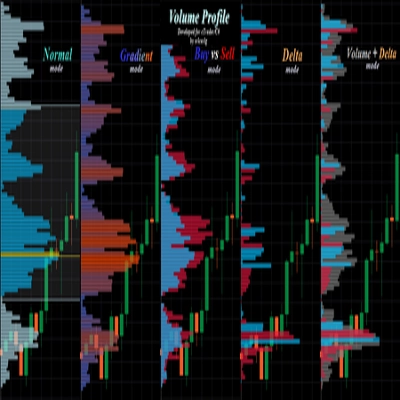
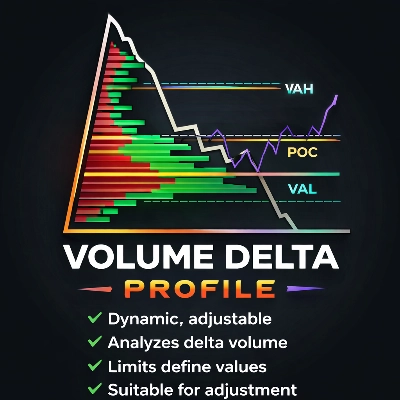
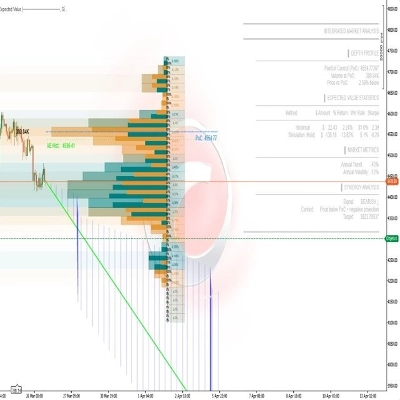
Free Volume Profile v2.0 | 4.8 (10) | 11.02K | — | Free | Windows, Mac |
Volume Profile Fixed Range - Pro | 4.3 (3) | — | 16 | $29 | Windows, Mac |
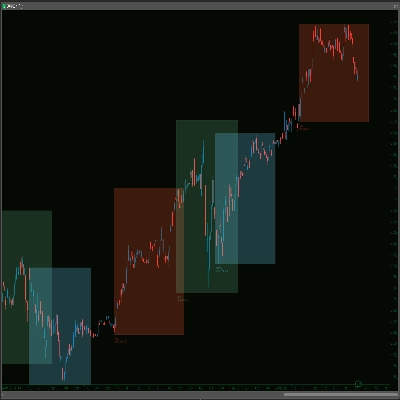
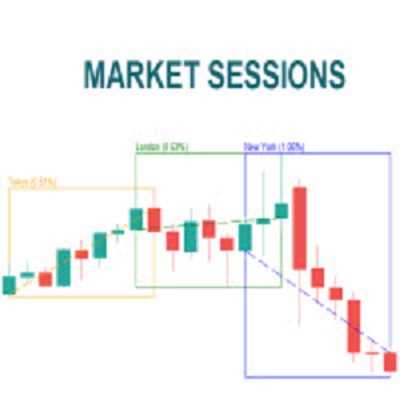
Market Sessions - Free | 4.1 (8) | 5.63K | — | Free | Windows, Mac |
LT Flexible Volume Profile | 5.0 (3) | — | 12 | $19 | Windows, Mac |
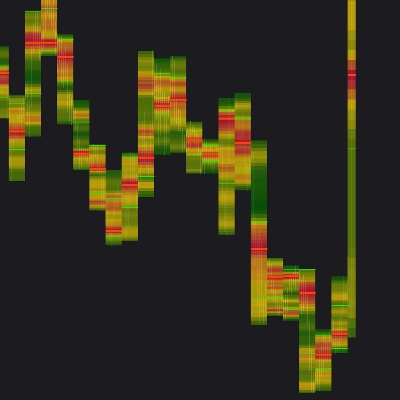
Volume POC Heatmap | 5.0 (4) | 4.07K | — | Free | Windows, Mac |
Volume Profile Pivot Box Range | 4.3 (3) | — | 12 | $49 | Windows, Mac |
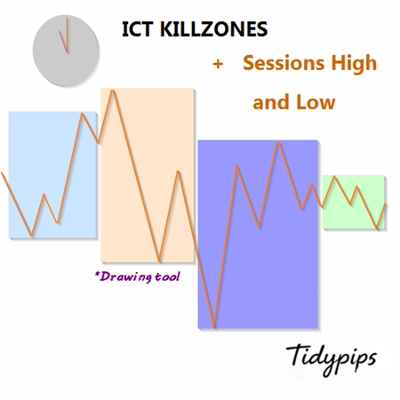
ICT Killzone and Sessions high_low | 3.2 (5) | 2.96K | — | Free | Windows, Mac |
Market_Profile_Prodessional | 4.0 (2) | — | 10 | $49 | Windows, Mac |
Market Sessions V2_NSC | 5.0 (2) | 1.94K | — | Free | Windows, Mac |
Volume Profile Pro | 5.0 (3) | — | 8 | $60 | Windows, Mac |
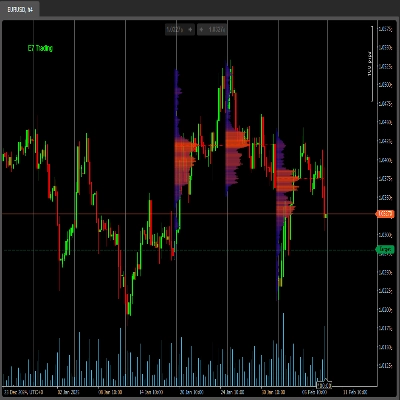
E7 Volume Profile | 4.7 (3) | 1.29K | — | Free | Windows, Mac |
Order Block with Volume | 5.0 (2) | — | 8 | from $9 | Windows, Mac |
v-anesore2 | — | 1.05K | — | Free | Windows, Mac |
Volume Profile Pivot Anchored | 4.7 (3) | — | 7 | $49 | Windows, Mac |
Market Sessions Pre | 4.3 (3) | 956 | — | Free | Windows, Mac |
Volume Profile Suite v1.1 | 4.5 (4) | — | 7 | $20 | Windows, Mac |
Volume Profile Price | 3.5 (2) | 932 | — | Free | Windows, Mac |
Candles Volume Delta | 4.7 (3) | — | 5 | $19 | Windows, Mac |
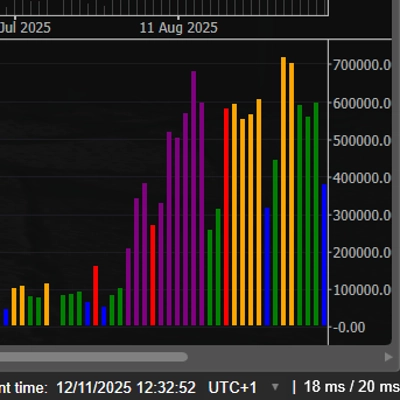
ColorfulTickVolume | 5.0 (3) | 715 | — | Free | Windows, Mac |
Smart Volume Delta | 3.5 (4) | — | 5 | $19 | Windows, Mac |
Candle Volume Profile Demo | 4.0 (1) | 613 | — | Free | Windows, Mac |
CVD | 4.7 (3) | — | 3 | $20 | Windows, Mac |
VPOC MonteCarlo Expected Value | 1.0 (1) | 499 | — | Free | Windows, Mac |
WVAP Neural Activity Scalp-Swing-Brake_noSourceCode | 4.5 (2) | — | 1 | $59 | Windows, Mac |
VolumeThermometer | — | 486 | — | Free | Windows, Mac |
Volume Edge Pro | — | — | 1 | $50 | Windows, Mac |
Vishal Volume Profile v2.0 | 4.0 (1) | 365 | — | Free | Windows, Mac |
MAQuantVolumeProfileCustomRange | 4.5 (2) | — | 1 | $30 | Windows, Mac |
VSA | 5.0 (2) | 346 | — | Free | Windows, Mac |
Flux Gate Precision | — | — | 1 | $29 | Windows, Mac |
Daily TPO profile | — | 264 | — | Free | Windows, Mac |
FXB Confluence Engine | 5.0 (1) | — | 1 | $29 | Windows, Mac |
Volume Activity Profiler | 5.0 (1) | 251 | — | Free | Windows, Mac |
Flintridge Trader Pro | — | — | — | $29 | Windows, Mac |
XY Bar Info Panel v1.5 | 5.0 (3) | 179 | — | Free | Windows, Mac |
Helix Volume Profile | 4.0 (1) | — | — | $29 | Windows, Mac |
Coppock Curve | — | 54 | — | Free | Windows, Mac |
Rigid Volume Profile | — | — | — | $29 | Windows, Mac |
Session Trend | 4.5 (2) | — | — | $32 | Windows, Mac |
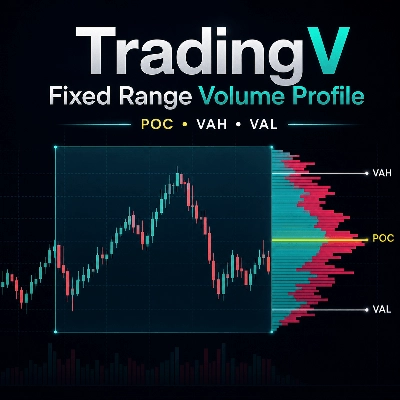
TradingV Fixed Range Volume Profile | — | — | — | $35 | Windows, Mac |
FAQ
Session volume is the amount of trading activity during a market window such as Asia, London or New York. Indicators for it shade each session, mark its high and low and plot tick counts, because forex has no central exchange that reports traded amounts.
A jump in tick volume as London opens shows activity arriving, and traders watch whether price then leaves the Asian range. Activity often stays high through the London and New York overlap and fades in late US hours, so the same signal can mean different things at different times of day.
London and New York switch to daylight saving on different dates, so session times set as fixed hours can drift. Check whether a tool adjusts automatically and which time zone it uses, because a wrong offset misplaces the overlap boxes for several weeks.
No, crypto trades around the clock, so its session lines are conventions, while DAX and NAS100 activity bunches around their cash-market opens. On forex, XAUUSD and index CFDs, volume readings come from the broker's feed, so the same tool can look different from one broker to another.
Add it to a chart on a computer running cTrader for Windows or Mac, then set its session hours, colours and time zone. For notifications, cTrader price alerts can use a pop-up, a sound or email when price reaches a level you mark, such as a session high.