Trading product for Skew Volatility Bias Indicator Indicator Signal Indices, image 1
Indicator
Version 1.0, Nov 2025
Windows, Mac
4.6
Reviews: 3
Trading product for Skew Volatility Bias Indicator Indicator Signal Indices, image 2
42.11M
Traded volume
6.13M
Pips won
203
Sales
7.83K
Free installs

📈 Skew Volatility Bias Indicator – Professional Version (for cTrader)

Unlock a deeper understanding of market pressure, volatility imbalance, and directional conviction with the Skew Volatility Bias Indicator, the enhanced version of a classic volatility-based approach originally inspired by Pine Script and now fully optimized for cTrader.

This tool helps traders visualize which side of the market is hitting harder — buyers or sellers — by measuring volatility asymmetry and converting it into a clear, easy-to-read signal.
Whether you're trading indices, forex, commodities or crypto, this indicator serves as a powerful trend filter, regime detector, and bias confirmation tool.


1. What the Skew Indicator Measures

The indicator evaluates the balance of volatility between bullish and bearish candles.
It calculates a normalized True Range and feeds it into two adaptive averages:

  • Deviation Max → volatility produced during up candles
  • Deviation Min → volatility produced during down candles

Then it computes:

👉 Skew = DeviationMax / DeviationMin

This converts raw volatility into a clear directional reading:

  • Skew > 1 → upside moves are stronger on average
  • Skew < 1 → downside moves are stronger
  • Skew ≈ 1 → volatility is symmetrical and the market is balanced

In short:

Skew reveals which side has “volatility dominance”.


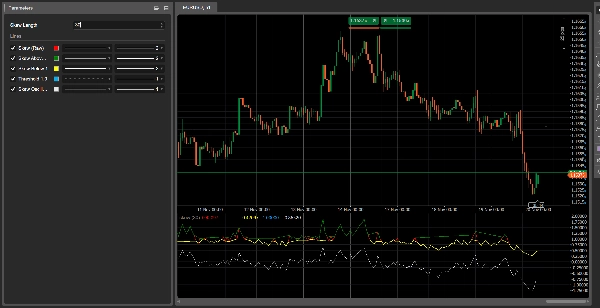
2. Understanding the Lines

1. Skew (Raw)Red line

The pure volatility ratio. This is the core signal.

2. Skew Above 1Green line

Shows bullish volatility dominance.

3. Skew Below 1Yellow line

Shows bearish volatility dominance.

4. Threshold 1.0 LineBlue dotted line

Represents equilibrium.

5. Skew Oscillator (log)White line

More stable, smoother representation:

  • above 0 = bullish volatility
  • below 0 = bearish volatility


3. How to Read It

A) Market Regimes

🔹 Bullish Regime

  • Skew > 1
  • Green line active
  • Oscillator above zero
    → Market favors longs.

🔹 Bearish Regime

  • Skew < 1
  • Yellow line active
  • Oscillator below zero
    → Market favors shorts.

🔹 Neutral

  • Skew ≈ 1
    → Market balanced, suitable for range trading.


4. Regime Shift Signals

Skew crossing above 1

→ Buyers gain volatility dominance
→ Bullish transition

Skew crossing below 1

→ Sellers gain volatility dominance
→ Bearish transition

These shifts often occur before price action confirms a trend, making Skew a powerful early indicator.


5. Practical Use Cases

1️⃣ Trend Filter for cBots

  • trade long only when SkewOsc > 0
  • trade short only when SkewOsc < 0

2️⃣ Trend Quality Confirmation

  • Uptrend + Skew > 1 = strong trend
  • Uptrend + Skew falling toward 1 = weakening trend

3️⃣ Market Sentiment / Risk Filter

Particularly effective on indices and FX major pairs.


6. Summary

  • What it shows: volatility dominance
  • Why it matters: volatility shifts precede price shifts
  • How to use it: as a filter, confirmation tool, or sentiment gauge
  • Best part: extremely light, fast, and adaptable


Indicator profile
4.6
Reviews: 3
5
67 %
4
33 %
3
0 %
2
0 %
1
0 %
Customer reviews
December 4, 2025
It is not flashy, but the decision feels less rushed. The result needs a journal.
December 3, 2025
Ngl, pressure is easier to read and that is enough to keep testing it, and It needs a boring test before bigger size.
December 2, 2025
Ngl, pressure is easier to read and that is enough to keep testing it, and A 5 minute check should not become a 30 minute rabbit hole.
Signal
Indices
Commodities
GBPUSD
RSI
Bollinger
Fibonacci
Scalping
AI
XAUUSD
NAS100
MACD
BTCUSD
Forex
Breakout
EURUSD
NZDUSD
Martingale
Prop
ZigZag
Supertrend
Fair Value Gap
SMC
Crypto
Grid
Stocks
ATR
USDJPY
VWAP
Products available through cTrader Store, including trading bots, indicators and plugins, are provided by third-party developers and made available for informational and technical access purposes only. cTrader Store is not a broker and does not provide investment advice, personal recommendations or any guarantee of future performance.

More from this author

Indicator
AI
ATR
+27
Read aggressive flow in real time. Flexible resets (Day/Week/Month), optional EMA smoothing, and non-repainting cumulati
cBot
AI
ATR
+27
The Prop-Ready Bot The Definitive Automaton for Challenges 🛡️ V2.0
Indicator
AI
Grid
+17
Editions: Free (core VWAP + bands) · Pro (multi‑VWAP, click‑to‑anchor, alerts).
cBot
AI
ATR
+21
A price-action-first algorithm to trade Breakout, Approach, and Return around prior High/Low levels—with Prop-style risk
Indicator
AI
ATR
+27
Volume Bubbles is a lightweight yet powerful visual indicator for cTrader
cBot
AI
ATR
+27
✅ Buy 3 prop accounts and manage just 1: cut management effort by 66% with a professional tool.
Indicator
AI
ATR
+27
Want a cBot based on this indicator? Contact us!
cBot
AI
Prop
+5
Premium algorithmic scalping for funded traders. Capture precise breakouts with ironclad risk management across all majo
14%
ROI
4
Profit factor
cBot
AI
ATR
+27
N.B.: Results with an initial invested capital of 100 euros.
cBot
AI
ATR
+27
AILevelTrader — Multi-AI Consensus Trading Bot 11 AI providers. One consensus. Prop Firm Ready.
1.9
Profit factor
Indicator
Prop
Forex
+15
ZigZag Free is a clean swing-detection tool that marks significant pivot highs/lows
cBot
ATR
RSI
+23
TrueScalper AI PRO v4.0 turns live market structure into disciplined AI-filtered scalping execution.
20%
ROI
5
Profit factor

You may also like

Indicator
Indices
Commodities
The Advanced CCI & EMA Indicator combines the CCI with 40 & 80 EMA logic to generate precise arrows signaling direction
Indicator
Prop
Forex
+5
Transform your approach to trading with our innovative Pivot Point Indicator.
Indicator
Order Block
Fair Value Gap
+3
This indicator scans multi-timeframe trend confluence and price action triggers within key supply/demand zones
Indicator
SMC
Prop
+13
Institutional FVG detection with HTF projection, precise volume deltas, and smart fill logic.
Indicator
EMA
RSI
+5
MACD Colour Histogram with 11 Moving Average Types, Multi-timeframe confirmation and Sound Signal Alert.
Indicator
ATR
CCI
+5
An institutional-grade trading system fusing triple hybrid moving averages, multi-oscillator momentum filters, Fair Valu
Indicator
BOS
Imbalance
+4
Automatically detects and highlights both Bullish and Bearish Fair Value Gaps (FVGs).
Indicator
AI
ATR
+27
VolumeProfileSuite is an advanced and flexible Volume Profile indicator for cTrader.
Indicator
AI
ATR
+27
Overbought Oversold Indicator
Indicator
Prop
Forex
+11
Market Structure Shift – Professional Market Structure Oscillator
Indicator
AI
ATR
+20
Detects smart money activity using advanced tick volume and price divergence analysis.
Indicator
Breakout
Allow trader to visualize Support & Resistance across different timeframes,give trader an overview of the current market
Indicator
Imbalance
Key Levels
+4
This indicator combines Multi-Timeframe Liquidity tracking, a dynamic Fair Value Gap (FVG) and a 50% Daily Range
Indicator
Forex
Customizable Dynamic Fibonacci Channels and Smart Alerts
Indicator
Forex
BTCUSD
+10
MultiTimeframe MA
Indicator
AI
ATR
+26
MacD Custom Indicator-Multiple Time Frame
Indicator
ATR
A lightweight Multi Time Frame bias dashboard for quickly spotting market direction across multiple timeframes.
Indicator
ATR
BTCUSD
+5
Trailing algo 📈 auto-tracks trends 🎯 adapts to volatility 🌟 precise moves 🛡️ retest signals 🚀 no lag, smart market
42.11M
Traded volume
6.13M
Pips won
203
Sales
7.83K
Free installs