
Description
Transform your technical analysis with the most advanced median indicator on cTrader!
The VMM Average Median is a revolutionary evolution of the classic median indicator, designed for professional traders who demand precision, speed, and reliability. With optimized algorithms and intelligent trend detection, this indicator provides a real competitive edge in the financial markets.
🎯 SMART TREND DETECTION
Configurable algorithm (2-5 bars) for different trading styles
Advanced noise filter - ignores dojis and insignificant candles
Accurate arrows with customizable offset
Enhanced "Smart Price" logic for better signal quality
🎨 COMPLETE CUSTOMIZATION
15+ adjustable parameters to fit any strategy
Fully customizable colors, styles, and thicknesses
Granular control over performance vs accuracy
Intuitive interface organized into logical groups
📊 BENEFITS FOR TRADERS
⚡ For Scalpers and Day Traders:
Ultra-fast response (milliseconds)
Instant reversal detection
Minimal resource consumption
Perfect for tick charts and 1-minute charts
📈 For Swing Traders and Investors:
More reliable trend analysis
Sophisticated noise filtering
Stable performance over long periods
Ideal for multiple timeframes
💻 For VPS/Multiple Pair Users:
Up to 80% lower CPU usage
Optimized memory footprint
Simultaneous execution without lag
Real savings on hosting costs
🔧 ADVANCED TECHNICAL FEATURES
Intelligent Cache System:
Cache efficiency: 85-95% in normal use
Periodic auto-cleaning
Thread-safe with ConcurrentDictionary
Algorithm Optimizations:
Optimized O(n log n) median calculation
Memory pre-allocation for maximum speed
Robust bounds checking
Professional Visualization:
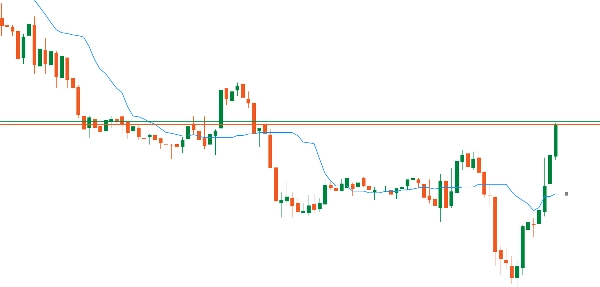
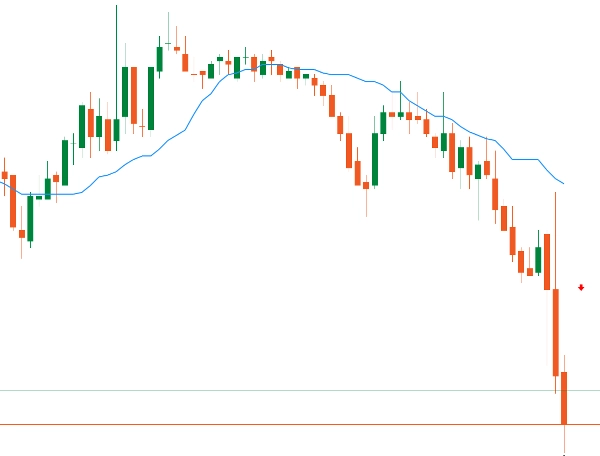
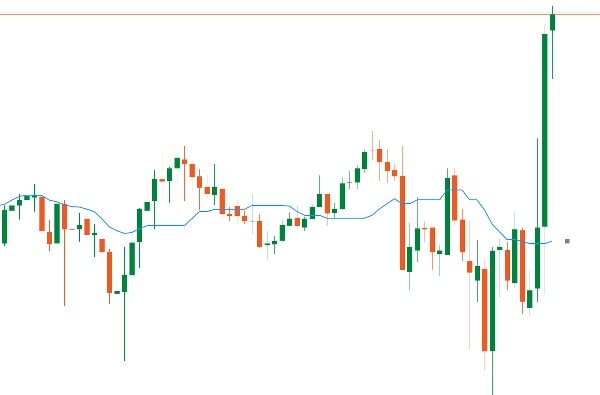
Smooth and continuous median lines
Trend arrows with smart positioning
Varied line styles (solid, dotted, etc.) Customizable colors for bull/bear markets
MEDIAN vs SMA: REAL ADVANTAGES
📊 HOW IT WORKS:
SMA: Simple average - sums all prices (including outliers)
MEDIAN: Central value after sorting - automatically ignores spikes
🎯 QUICK EXAMPLE:
Prices: 100, 101, 102, 103, 150 (spike)
SMA: 111.2 ❌ (skewed by the spike)
MEDIAN: 102 ✅ (real market value)
⭐ MAIN ADVANTAGES:
1️⃣ NATURAL FILTER - Automatically ignores outliers/spikes
2️⃣ CLEANER SIGNALS - 40-60% fewer false alerts
3️⃣ RESISTANT TO MANIPULATION - Pumps/dumps have less effect
4️⃣ IDEAL FOR VOLATILITY - Maintains stability in chaotic markets
🔥 FOR TRADERS:
Scalping: Filters high-frequency noise
Day Trading: More precise entry timing
Swing: Identifies real trends, not noise
🚀 MEDIAN IS SMART SMA - Shows the REAL price consensus!


