AbsorptionRatio_AutoRiskPanel
Indicator
Version 1.0, Dec 2025
Windows, Mac
5.0
Reviews: 1
Description
AbsorptionRatio_AutoRiskPanel transforms any cTrader symbol into a live risk-regime dashboard 🛰️.
Instead of relying on multiple ETFs like the original multi-asset Absorption Ratio, this indicator builds a single-symbol AR proxy directly from the price action of the instrument you’re trading:
- 📉 It calculates log returns of the current symbol.
- 🔗 It measures autocorrelation of returns across several lags (1…7 bars, depending on the correlation period).
- 📊 It aggregates the average absolute autocorrelation and maps it into a normalized Absorption Ratio between 0.5 and 1.0 — higher values mean more concentration and tighter behaviour.
- 🧬 It smooths the raw signal with an EMA, producing a stable AR curve.
- 🧪 Over a rolling statistical lookback, it computes:
- the mean and standard deviation of AR
- the current Z-Score (how many σ above/below the mean)
- the percentile rank of today’s AR vs history
- 🤖 With Auto Thresholds enabled, the indicator continuously self-calibrates risk levels:
- Low Risk ≈
mean − 0.5σ - High Risk ≈
mean + 0.5σ - Extreme Risk ≈
mean + 1.5σ
Values are clamped to[0…1]and updated bar by bar, so the regimes adapt to each symbol and timeframe.
- Low Risk ≈
- 🧱 From these thresholds, AbsorptionRatio_AutoRiskPanel defines four dynamic regimes:
- LOW → dispersed, easy-going / risk-on environment
- NORMAL → balanced / neutral conditions
- HIGH → elevated clustering, risk-off tendencies
- EXTREME → stressed environment, potential systemic risk spike 🛑
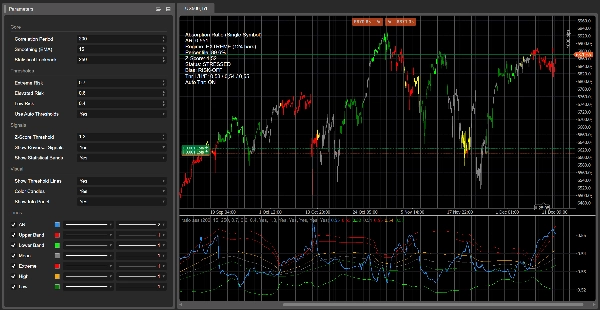
- 🕯️ On the main chart, candles can be color-coded by risk:
This gives you an immediate visual filter: for example, only trade trend entries when candles are not in red/orange, or size down during stressed regimes. - 🔴 Red → AR statistically stressed (Z-Score ≥ threshold)
- 🟢 Lime → AR statistically calm (Z-Score ≤ −threshold)
- 🟧 / 🟡 Orange/Yellow → above High / near Extreme
- ⚪ Gray → neutral zone
- 💚 Green → low AR, more dispersed / risk-on behaviour
- 🎯 Optional mean-reversion signals in the AR panel:
- 🟢 Buy arrow when AR is statistically calm and starts to turn up
- 🔴 Sell arrow when AR is statistically stressed and starts to roll over
- 📋 A compact info panel in the top-left corner displays:
- current AR value
- active Regime + duration (bars spent in this regime)
- Percentile, Z-Score and qualitative Status (STRESSED / CALM / NORMAL)
- risk Bias (RISK-ON / RISK-OFF / NEUTRAL)
- the effective Low / High / Extreme thresholds used and whether Auto Thresholds are ON or OFF
Use AbsorptionRatio_AutoRiskPanel to:
- avoid trading during statistically stressed, risk-off regimes
- identify calm environments where breakouts or trend-following may work better
- contextualize any strategy inside a dynamic risk regime framework rather than using fixed volatility filters.
⚙️ Parameters (store docs)
Core ⚙️
- Correlation Period – Length of the autocorrelation window. Controls how much history is used to estimate the Absorption Ratio. Larger values = smoother, more “macro” regime; smaller values = faster but noisier.
- Smoothing (EMA) – EMA period applied to the raw AR signal. Higher values smooth regime changes, lower values make the indicator more reactive.
- Statistical Lookback – Lookback period for AR mean, standard deviation, Z-Score and percentile. Governs how fast the statistical baseline adapts.
Thresholds 🚦
- Extreme Risk / Elevated Risk / Low Risk – Manual thresholds for AR regimes (LOW / NORMAL / HIGH / EXTREME) used when Auto Thresholds is OFF. With Auto ON they are ignored for logic and only visible as defaults.
- Use Auto Thresholds – When ON, thresholds are derived from the rolling AR statistics:
- Low Risk = mean − 0.5σ
- Elevated Risk = mean + 0.5σ
- Extreme Risk = mean + 1.5σ
Signals 🎯
- Z-Score Threshold – Minimum absolute Z-Score to classify AR as statistically extreme. Drives STRESSED/CALM labels, candle overrides, and mean-reversion arrows.
- Show Reversal Signals – Enables/disables BUY/SELL arrows in the AR sub-window.
- Show Statistical Bands – Toggles ±2σ bands and the mean line around AR.
Visual 🎨
- Show Threshold Lines – Shows the effective Low / High / Extreme levels used by the regime engine (manual or auto).
- Color Candles – Colors price candles according to Z-Score and regime level for instant risk visualization.
- Show Info Panel – Displays the text panel in the top-left corner with AR, regime, stats and bias.
Summary
Indicator profile
Customer reviews
5.0
Reviews: 1
5 | 100 % | |
4 | 0 % | |
3 | 0 % | |
2 | 0 % | |
1 | 0 % |
Customer reviews
December 20, 2025
the cleanest use is it makes weak ideas easier to leave alone, and It should stay in the support stack.
Discussion
FAQ
Signal
Indices
Commodities
GBPUSD
RSI
Bollinger
Fibonacci
Scalping
AI
XAUUSD
NAS100
MACD
BTCUSD
Forex
Breakout
EURUSD
NZDUSD
Martingale
Prop
ZigZag
Supertrend
Fair Value Gap
SMC
Crypto
Grid
Stocks
ATR
USDJPY
VWAP
Products available through cTrader Store, including trading bots, indicators and plugins, are provided by third-party developers and made available for informational and technical access purposes only. cTrader Store is not a broker and does not provide investment advice, personal recommendations or any guarantee of future performance.


Price
42.11M
Traded volume
6.13M
Pips won
221
Sales
8.35K
Free installs