"Smart Tech Analysis Pro" logo
Smart Tech Analysis Pro
"Smart Tech Analysis Pro" uploaded image
87
Sales
5.34K
Free installs

🚀 Transform Your Chart into a Strategic Decision Center


Smart Tech Analysis is not just an indicator.

It's a complete intelligent analysis dashboard, developed for traders who want clarity, precision, and agility in decision-making.

While most indicators deliver only isolated information, Smart Tech Analysis integrates:


✔ Trend

✔ Volume

✔ Fibonacci

✔ Support and Resistance

✔ Technical Signals

✔ Operational Recommendations

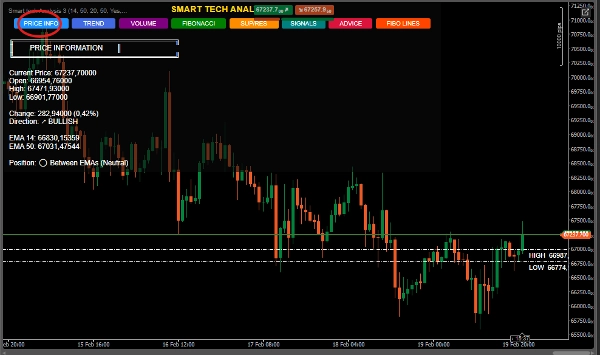
✔ Detailed Price Information


All in a single dynamic and interactive dashboard.


🔥 THE BIG DIFFERENCE

🎯 1. 6-in-1 System – Integrated Analysis

You no longer need to switch between multiple indicators.

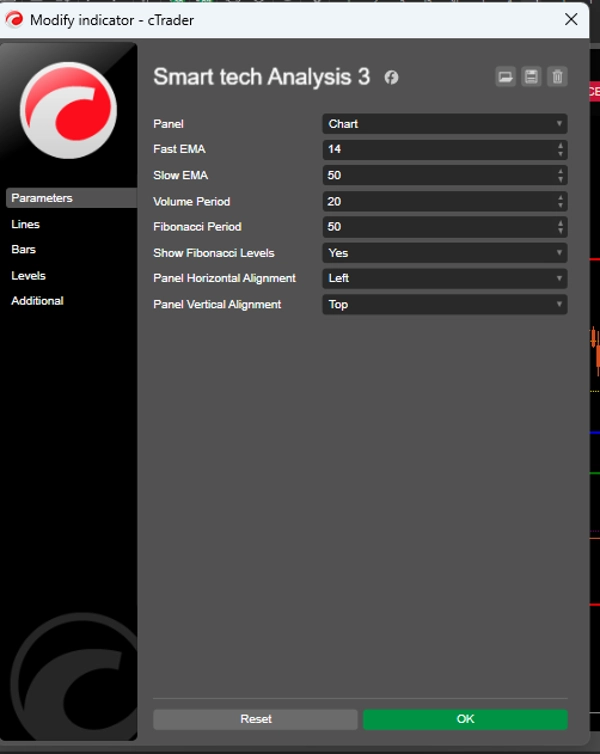
Smart Tech Analysis combines:


📈 Fast and slow EMAs (14 and 50)

📊 Volume with comparative analysis

🧩 Automatic Fibonacci

🛡 Dynamic support and resistance

🚦 Intelligent signal generation

📌 Recommendations with calculated stop and target

👉 This reduces visual noise and increases objectivity.


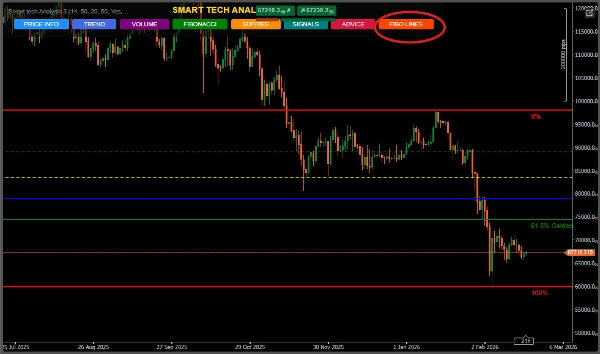
🧠 2. Exclusive Interactive Panel


Professional interface with smart buttons:

PRICE INFO

TREND

VOLUME

FIBONACCI

SUP/RES

SIGNALS

ADVICE


The trader chooses exactly what they want to see.


📌 Organization.

📌 Control.

📌 Professionalism.


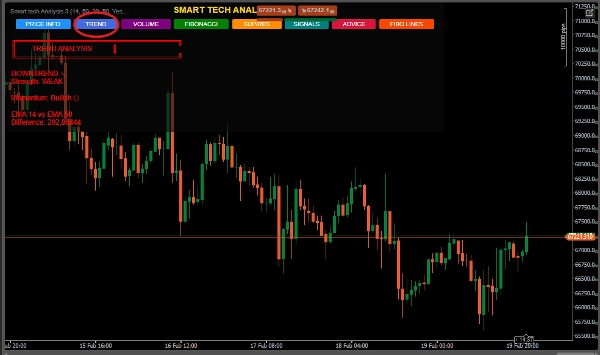
📈 3. Trend Analysis with Strength and Momentum


It doesn't just show if it's going up or down.

It calculates:

Trend intensity

Percentage strength between EMAs

Classification: Weak, Moderate, or Strong

This avoids weak entries in sideways markets.


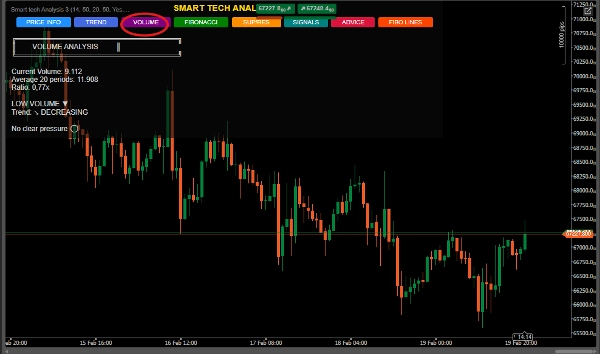
📊 4. Volume with Institutional Reading

The system identifies:

Extreme volume

Buying or selling pressure

Acceleration or deceleration

Comparison with historical average

👉 Ideal for detecting possible institutional activity.


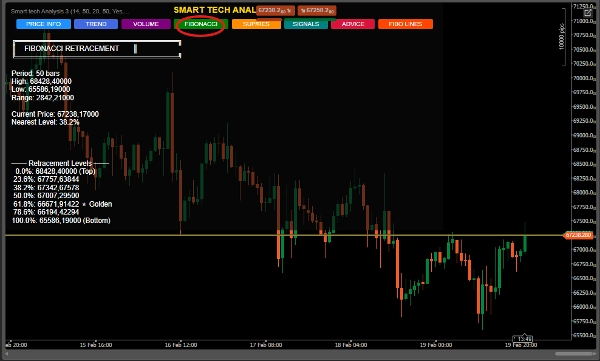
🧩 5. Automatic Fibonacci with Golden Zone

Calculated dynamically over the defined period.

Special highlight for:

⭐ 61.8% Zone (Golden Zone)

📌 Identification of the nearest level

📌 Bullish and bearish extensions

📌 Automatic contextual recommendation

Perfect for retracement traders and swing traders.


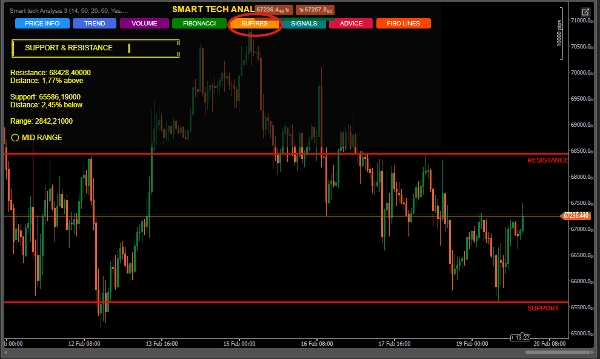
🛡 6. Intelligent Support & Resistance

Detects relevant highs and lows

Shows percentage distance from the current price

Classifies position: Near support, resistance, or mid-range

Draws automatic lines on the chart

Ideal for entering strategic zones.


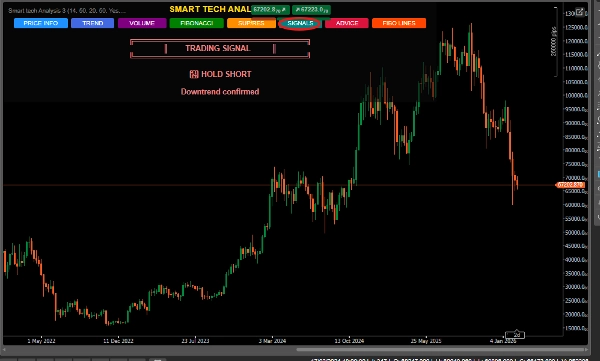
🚦 7. Confluence Signal System


The algorithm does not generate random signals.

It combines:

✔ EMA crossover

✔ Proximity to support/resistance

✔ Trend structure

✔ Price context


Classification:


🟢 STRONG BUY

🔴 STRONG SELL

📈 HOLD LONG

📉 HOLD SHORT

⏸ WAIT


With indicated confidence level.


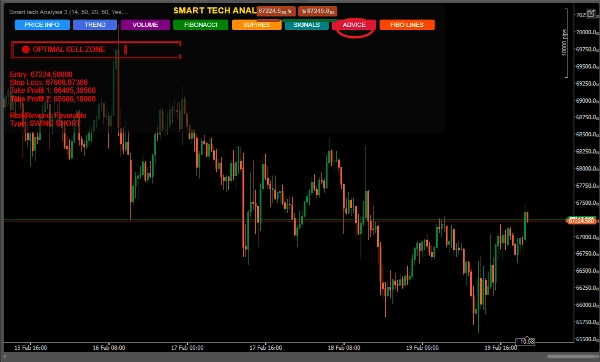
🎯 8. Recommendations with Risk Management

The "ADVICE" panel delivers:

Suggested entry

Technical Stop Loss

Two Take Profit targets

Swing structure (Long or Short)

Operation context

👉 It's not just analysis.

👉 It's a structured plan.

🏆 Who is this indicator for?


✔ Beginner traders who need clarity

✔ Intermediate traders who want confluence

✔ Advanced traders seeking efficiency

✔ Swing traders

✔ Scalpers who use structural confirmation


💎 Why does it stand out in the market? Common Indicators Smart Tech Analysis

Isolated Information Integrated Analysis Visual Pollution Organized Dashboard No Context Technical Confluence No Management Suggested Stop and Target Simple Signals Signals with Confirmation


📊 Direct Benefits


✔ Reduces emotional decisions

✔ Increases accuracy

✔ Improves structural reading

✔ Saves time

✔ Raises the professional standard of the trader


🧠 Market Positioning

Smart Tech Analysis is ideal for:

Forex Market

Indices

Commodities

Cryptocurrencies

Indicator profile
0.0
Reviews: 0
Customer reviews
No reviews for this product yet. Already tried it? Be the first to tell others!
Prop
Forex
Signal
Indices
EURUSD
Commodities
Fibonacci
XAUUSD
Products available through cTrader Store, including trading bots, indicators and plugins, are provided by third-party developers and made available for informational and technical access purposes only. cTrader Store is not a broker and does not provide investment advice, personal recommendations or any guarantee of future performance.

More from this author

Order BlockIndicator reversal
Precision Scalper,XAUUSD ,Averages that functions like a multidimensional radar:
34.8%
2.12
Profit factor
5%
Max drawdown
Intelligent negotiations and analysis!
47.3%
3
Profit factor
2%
Max drawdown
Intelligent system, Available any instrument. Profit 12. Drawdown 1%
12.29
Profit factor
1.44%
Max drawdown
Volume Profile Price Period and Live VAH,VAL,POC,
Chart Patterns Algo Bot
Profitable low-risk robot, ROI 32% month, live,
36.8%
3.4
Profit factor
7%
Max drawdown
INDICATOR,LIQUIDITY POOLS,ACCURATE SIGNAL, NO DELAY,80% PROBABILITY
PVA Volume Analysis Indicator:Price volume over trend strength and direction
Trend analysis, automatic analysis, position, swingtrader, scalper
Indicator,combines with several strategies.MA locate trends,pullback, signal volumes, reversals, support and resistance
POSITION 5000 Pips: The Ultimate Algorithm for Gold
16.8%
4
Profit factor
5%
Max drawdown

You may also like

Day of Week Indicator for cTrader
IR Candle Open plots customizable opening price lines for daily, weekly, and monthly candles
Regime-aware SMC indicator scoring BOS/CHoCH, OBs, FVGs & liquidity sweeps 0-10 with structure-based TPs
Supply and demand zones. They're important. Here's a free version to get you started!
Market Profile TPO – Advanced Auction Market Analysis for cTrader
🎯 Automatically identify significant breakouts from price consolidation zones.
Master market structure with auto ZigZag, Pattern detection & MTF alerts.
Trend Cycle – measure the life of your trends. See how long the current move has been running and how long similar trend
Binary Options Signals Pro – Precision Trading at Your Fingertips
Momentum-adaptive MA: scales responsiveness via deviation — fast in trend, smooth in chop.
📊 🚀 “Anticipate the Market with Wyckoff Smart Zones – Discover Where Institutions Buy and Sell”
Detect powerful 2-candle reversal patterns at key highs/lows. Boost entries with real-time alerts and visual signals.
Spot Inside Bar breakouts across all timeframes on cTrader
Ichimoku Kinkō Hyō with fixed shift to 25 as Ctrader calculate it from 0 and values was wrong for Chikou Span and Kumo.
VWAP Tabajara
Analyze institutional imbalance with HAIQuantum_TheGame. A 20-factor ecosystem designed to identify
Market Spirit Market Extremes Detector
Multi-asset screener with real-time RSI/volatility analysis, interactive dashboard, and color-coded trading signals.
87
Sales
5.34K
Free installs