Description
This is an institutional price reading tool based on percentage levels + liquidity reference.
🧠 Asset Class Recognition
Forex, Crypto, Indices, Commodities, Stocks, Futures
🔎 WHAT THIS INDICATOR REALLY DOES
It transforms the market into:
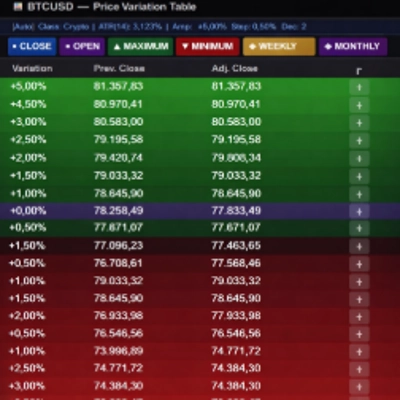
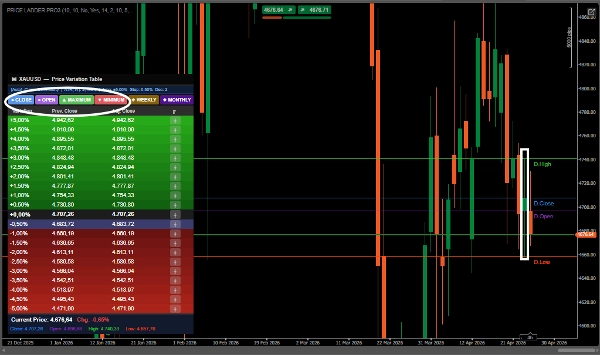
1. 📊 Percentage zones from the previous close
Ex: +0.5%, +1%, -1%, -2%...
This creates a kind of price expansion map
👉 This is VERY used by institutional investors (implied daily volatility)
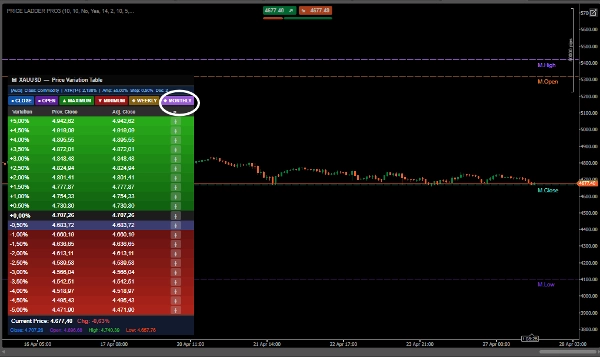
📍 Automatic key levels
You can turn on:
Previous close
Previous open
High/low
Weekly range
👉 This = liquidity + institutional reference
3. 🎯 Custom lines (╋ button)
You can manually mark important levels
👉 This becomes dynamic support/resistance
🧠 BEST STRATEGIES FOR USE
1. 🚀 BREAKOUT AND EXPANSION Strategy (the best)
How to use:
Connect:
Previous close
High / low
Weekly or monthly
Note:
If the price breaks:
Previous high
+1% / +1.5% / +2% (automatic calculation of variation per asset)
👉 This indicates institutional expansion
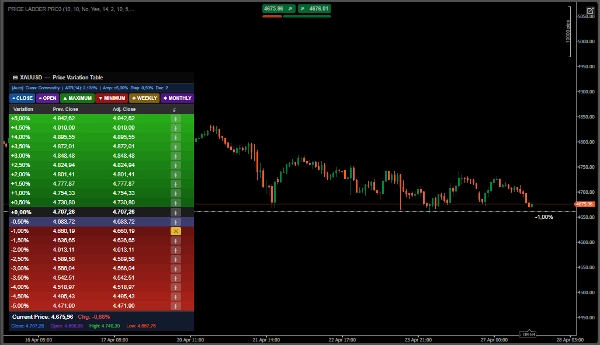
2. 🔄 REVERSAL Strategy (mean reversion)
This indicator is excellent for this.
How to use:
If the price reaches:
+2% / +3%
or -2% / -3%
👉 High chance of:
Exhaustion Pullback
Entry:
✔ Sell:
Region +2% or +
With rejection (wick/candle)
✔ Buy:
Region -2% or -
Target:
Return to:
👉 0% (previous close)
👉 This works VERY well on:
XAUUSD EURUSD in sideways movement
3. 🏦 INSTITUTIONAL Strategy (best real-world use)
This is where your indicator shines.
Concept:
Institutional investors think like this:
Where is the price relative to the previous day?
How much has it expanded?
There's still room for improvement.
Main features of the Turtle Strategy:
1. Automatic Breakout Levels
Shows High and Low of the previous period (yesterday/week/month)
Displays Close and Open as reference points
Perfect for identifying 20/55 day breakouts (you can adapt this)
2. Expansion Levels by Percentage Variation
Similar to the Turtle's volatility unit concept
Allows you to see price levels with X% variation
Useful for setting profit targets (e.g., 2% above the breakout)
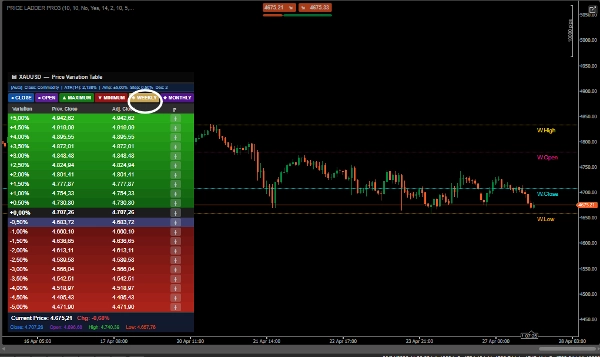
3. Quick Buttons
MAXIMUM/MINIMUM: Shows resistance/support levels
WEEKLY/MONTHLY: Long-term seasonality
4. Auto-Adjustment by ATR
ATR is the heart of the Turtle (positioning by volatility)
Automatically calculates ranges based on real volatility
Summary
Customer reviews
5 | 100 % | |
4 | 0 % | |
3 | 0 % | |
2 | 0 % | |
1 | 0 % |


