"Market Structure Trend Targets" logo
Indicator
Version 1.0, May 2026
Windows, Mac
"Market Structure Trend Targets" uploaded image
32
Sales
2.08K
Free installs

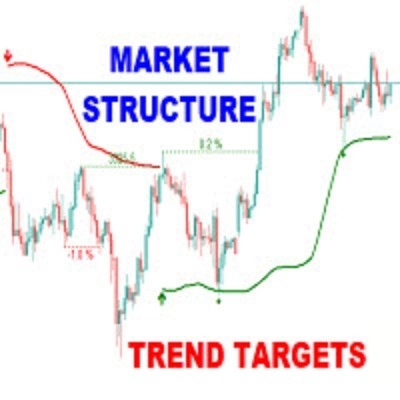
The Market Structure Trend Targets is a powerful trading indicator designed to give traders a clear, structured, and data-driven view of market momentum, breakouts, and key price reaction zones. Built on the principles of smart market structure analysis, it helps identify not only trend direction, but also precise breakout levelstrend exhaustion, and potential reversal zones — all with visual clarity and trader-friendly metrics.

Key Features

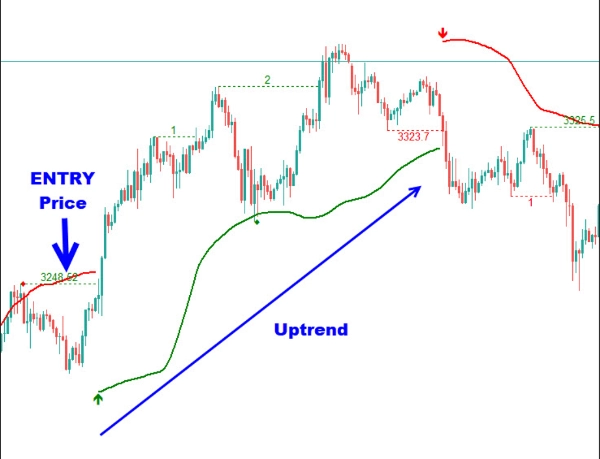
Breakout Points with Numbered Markers

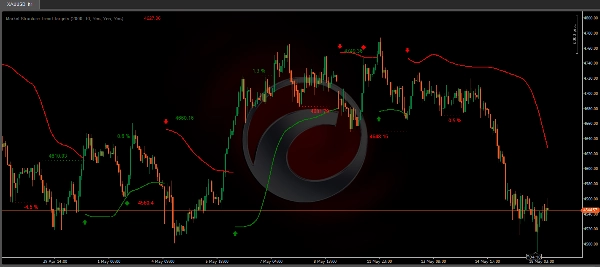
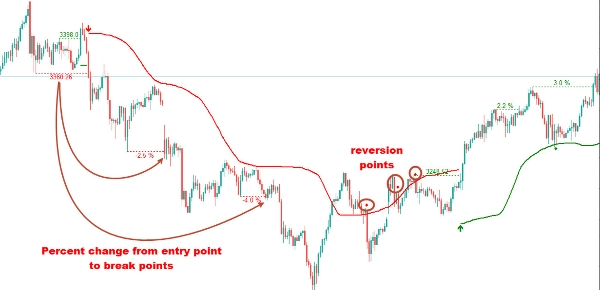
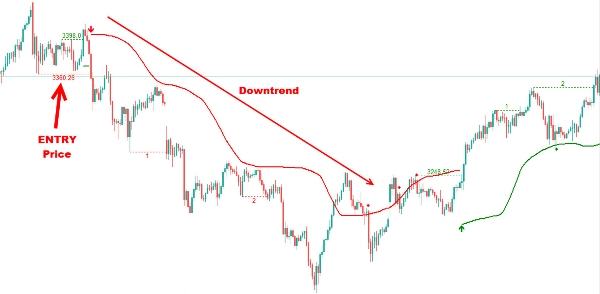
Track significant structural breakouts with sequential numbered markers, helping you visually follow the progression of price action. Whether the market is in an uptrend or downtrend, each breakout point is logged and displayed for easy backtracking and confirmation of structural shifts. The initial breakout (zero break) is marked with the entry price and a arrow icon, while subsequent breakouts within the trend are numbered sequentially (1, 2, 3…) to indicate trend continuation.
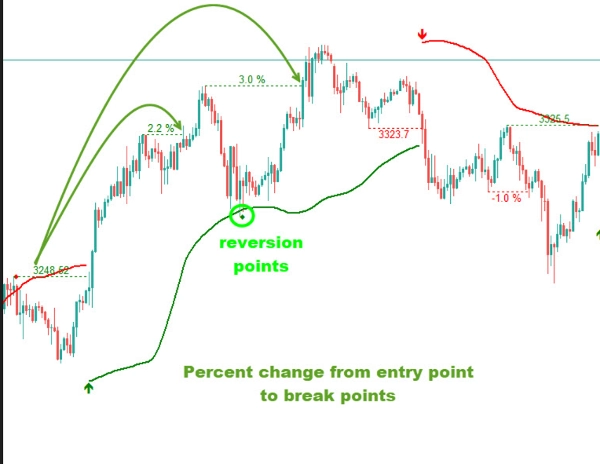
Percentage Change

See exactly how much price has moved from each breakout point with percentage change labels. This gives you a real-time sense of market strength, volatility, and potential exhaustion, helping you gauge whether a move still has fuel — or is nearing its limit.

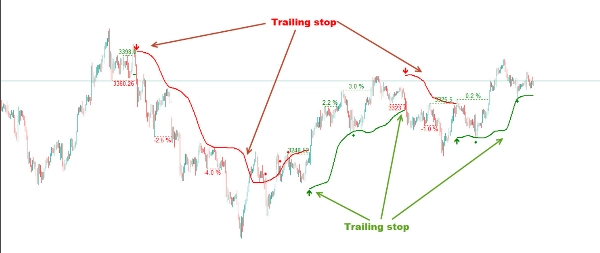
Trailing Stop Loss Levels

This indicator auto-calculates dynamic stop loss levels based on recent structural pivots, breakout confirmation, and volatility. These smart levels adjust as price moves, helping traders trail trends while managing risk with precision. If the price breaches the stop loss level, the indicator will show points indicating a potential end or reversal of the trend.

Reversion Signals

The indicator identifies potential mean reversion points with diamond icons. In an uptrend, if the price falls below the stop loss and then re-enters above it, a diamond is plotted, suggesting a possible mean reversion. Similarly, in a downtrend, if the price moves above the stop loss and then falls back below, it indicates a reversion possibility.

 Use Cases:

  • Trend-following strategies based on market structure
  • Confirmation for Smart Money Concepts (SMC) setups
  • Dynamic target and stop placement for swing & intraday traders
  • Visual trade journaling and breakout tracking
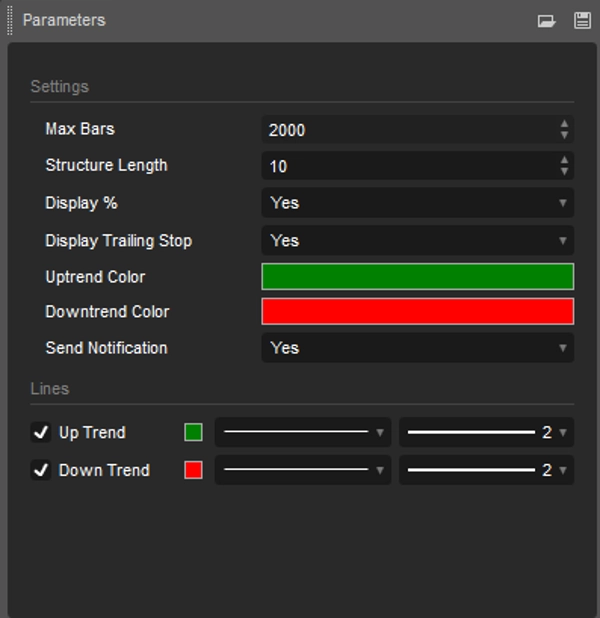
User Inputs:

  • Length: Defines the number of bars used to identify pivot highs and lows for trend breakouts.
  • Display Percentage: Option to toggle between showing sequential breakout numbers or the percentage change from the initial breakout.
  • Display Trailing Stop: Show trailing stop on chart
  • Colors for Uptrend and Downtrend: Allows customization of color zones for uptrends and downtrends to match individual chart preferences.
  • Alert/Notification: Allows send alert or notification to mobile

The Market Structure Trend Targets transforms price action into actionable, easy-to-read insights — giving traders a tactical edge with clarity, control, and confidence.

Indicator profile
Indicator category
Pattern
Output type
Visualisation
Data requirements
Bars only
Supported signals
Breakout
0.0
Reviews: 0
Customer reviews
No reviews for this product yet. Already tried it? Be the first to tell others!
Supertrend
Key Levels
MSS
Market Structure
Products available through cTrader Store, including trading bots, indicators and plugins, are provided by third-party developers and made available for informational and technical access purposes only. cTrader Store is not a broker and does not provide investment advice, personal recommendations or any guarantee of future performance.

More from this author

Indicator
SMC
Forex
+7
The Fair Value Gap (FVG) Indicator identifies inefficiencies in price action where an imbalance occurs due to aggressive
Indicator
SMC
Forex
+7
Simple Smart Money Concepts (SMC)
Indicator
Forex
BTCUSD
+6
The Market Sessions indicator is a popular tool for visually representing global trading sessions on a price chart.
Indicator
SMC
Forex
+5
Pure Price Action ICT Tools
Indicator
MACD
Forex
+5
MACD Indicator with Histogram that plots Colors Based on Direction Above and Below the Zero Line.
Indicator
Forex
BTCUSD
+6
All-In-One solution for ICT's FVG IFVG ORDERBLOCK in advanced mode.
Indicator
Forex
BTCUSD
+4
The Linear Regression Oscillator (LRO) is a technical indicator based on linear regression analysis.
Indicator
Forex
BTCUSD
+5
Simple ICT Concepts
Indicator
Forex
BTCUSD
+5
This indicator displays the OrderBlocks of the current and higher timeframe, made by ICT's student.
Indicator
Forex
BTCUSD
+4
This indicator is designed to perform multiple non-linear regression analysis using four independent variables.
Indicator
ATR
EMA
+4
Trendlines Oscillator
Indicator
ATR
EMA
+5
Trend Duration Forecast.

You may also like

Indicator
Prop
Forex
+13
Supertrend - Multi-Timeframe Indicator
Indicator
Prop
Forex
+11
🧭 See when your market tends to move—by Month, Day-of-Week, or Hour-of-Day🧭
Indicator
AI
ATR
+26
Entry Momentum MACD Power Guide
Indicator
Forex
BTCUSD
+10
MultiTimeframe MA
Indicator
AI
Prop
+7
EMA Clouds, Multi-Timeframe (MTF) Overlay, Swing High/Low detection, and a smart Dashboard with neutral zone filtering.
Indicator
BOS
MSS
+5
WinSMC is an overlay SMC indicator for cTrader. It helps you visually identify!
Indicator
Prop
Forex
+5
Higher TimeFrame Candle Tracker: Current Timeframe (Any TimeFrame) Show High TimeFrame Candle Bar
Indicator
ATR
RSI
+8
Multi-timeframe market-state dashboard: Score (-100..+100) + UP/NEUT/DN per TF, with optional closed-candle arrows.
Indicator
EMA
SMA
+3
MACD indicator modeled after TradingView, featuring a 4-color momentum histogram, sound/pop-up crossover alerts.
Indicator
ATR
Market Structure
+3
Support Resistance Toolkit
Indicator
ATR
RSI
+9
🚀 MACARX Indicator - The Multi-Indicator Trend Fusion 🚀
Indicator
Prop
Forex
+4
This is an indicator that can alert you about trendlines, horizontal lines and vertical lines.
Indicator
RSI
SMA
+1
TradingView RSI replica for cTrader with dynamic gradients, automatic divergence detection, and alerts.
Indicator
RSI
MACD
+1
Precision Supply & Demand zones indicator—automatically plots key buy/sell areas on your chart for smarter entries.
Indicator
Market Structure
Support & Resistance
Auto-centers price when it moves beyond threshold. Adjustable zoom. Works on any chart type. Never lose price again.
Indicator
MCDX is a powerful and innovative indicator.
Indicator
Forex
Indices
+1
Professional Fair Value Gaps with multitimeframe spot on
Indicator
ATR
SMC
+5
Candles Volume Delta is a powerful, visually intuitive indicator that transforms raw tick volume into actionable trading
32
Sales
2.08K
Free installs