Brokers & props
For business
00
Days
:
00
Hours
:
00
Minutes
:
00
Seconds
Supply Demand - BasicV1
"Supply Demand - BasicV1" logo
Since 14/01/2025
Sales
35
Free installs
6943
"Supply Demand - BasicV1" uploaded image"Supply Demand - BasicV1" uploaded image"Supply Demand - BasicV1" uploaded image

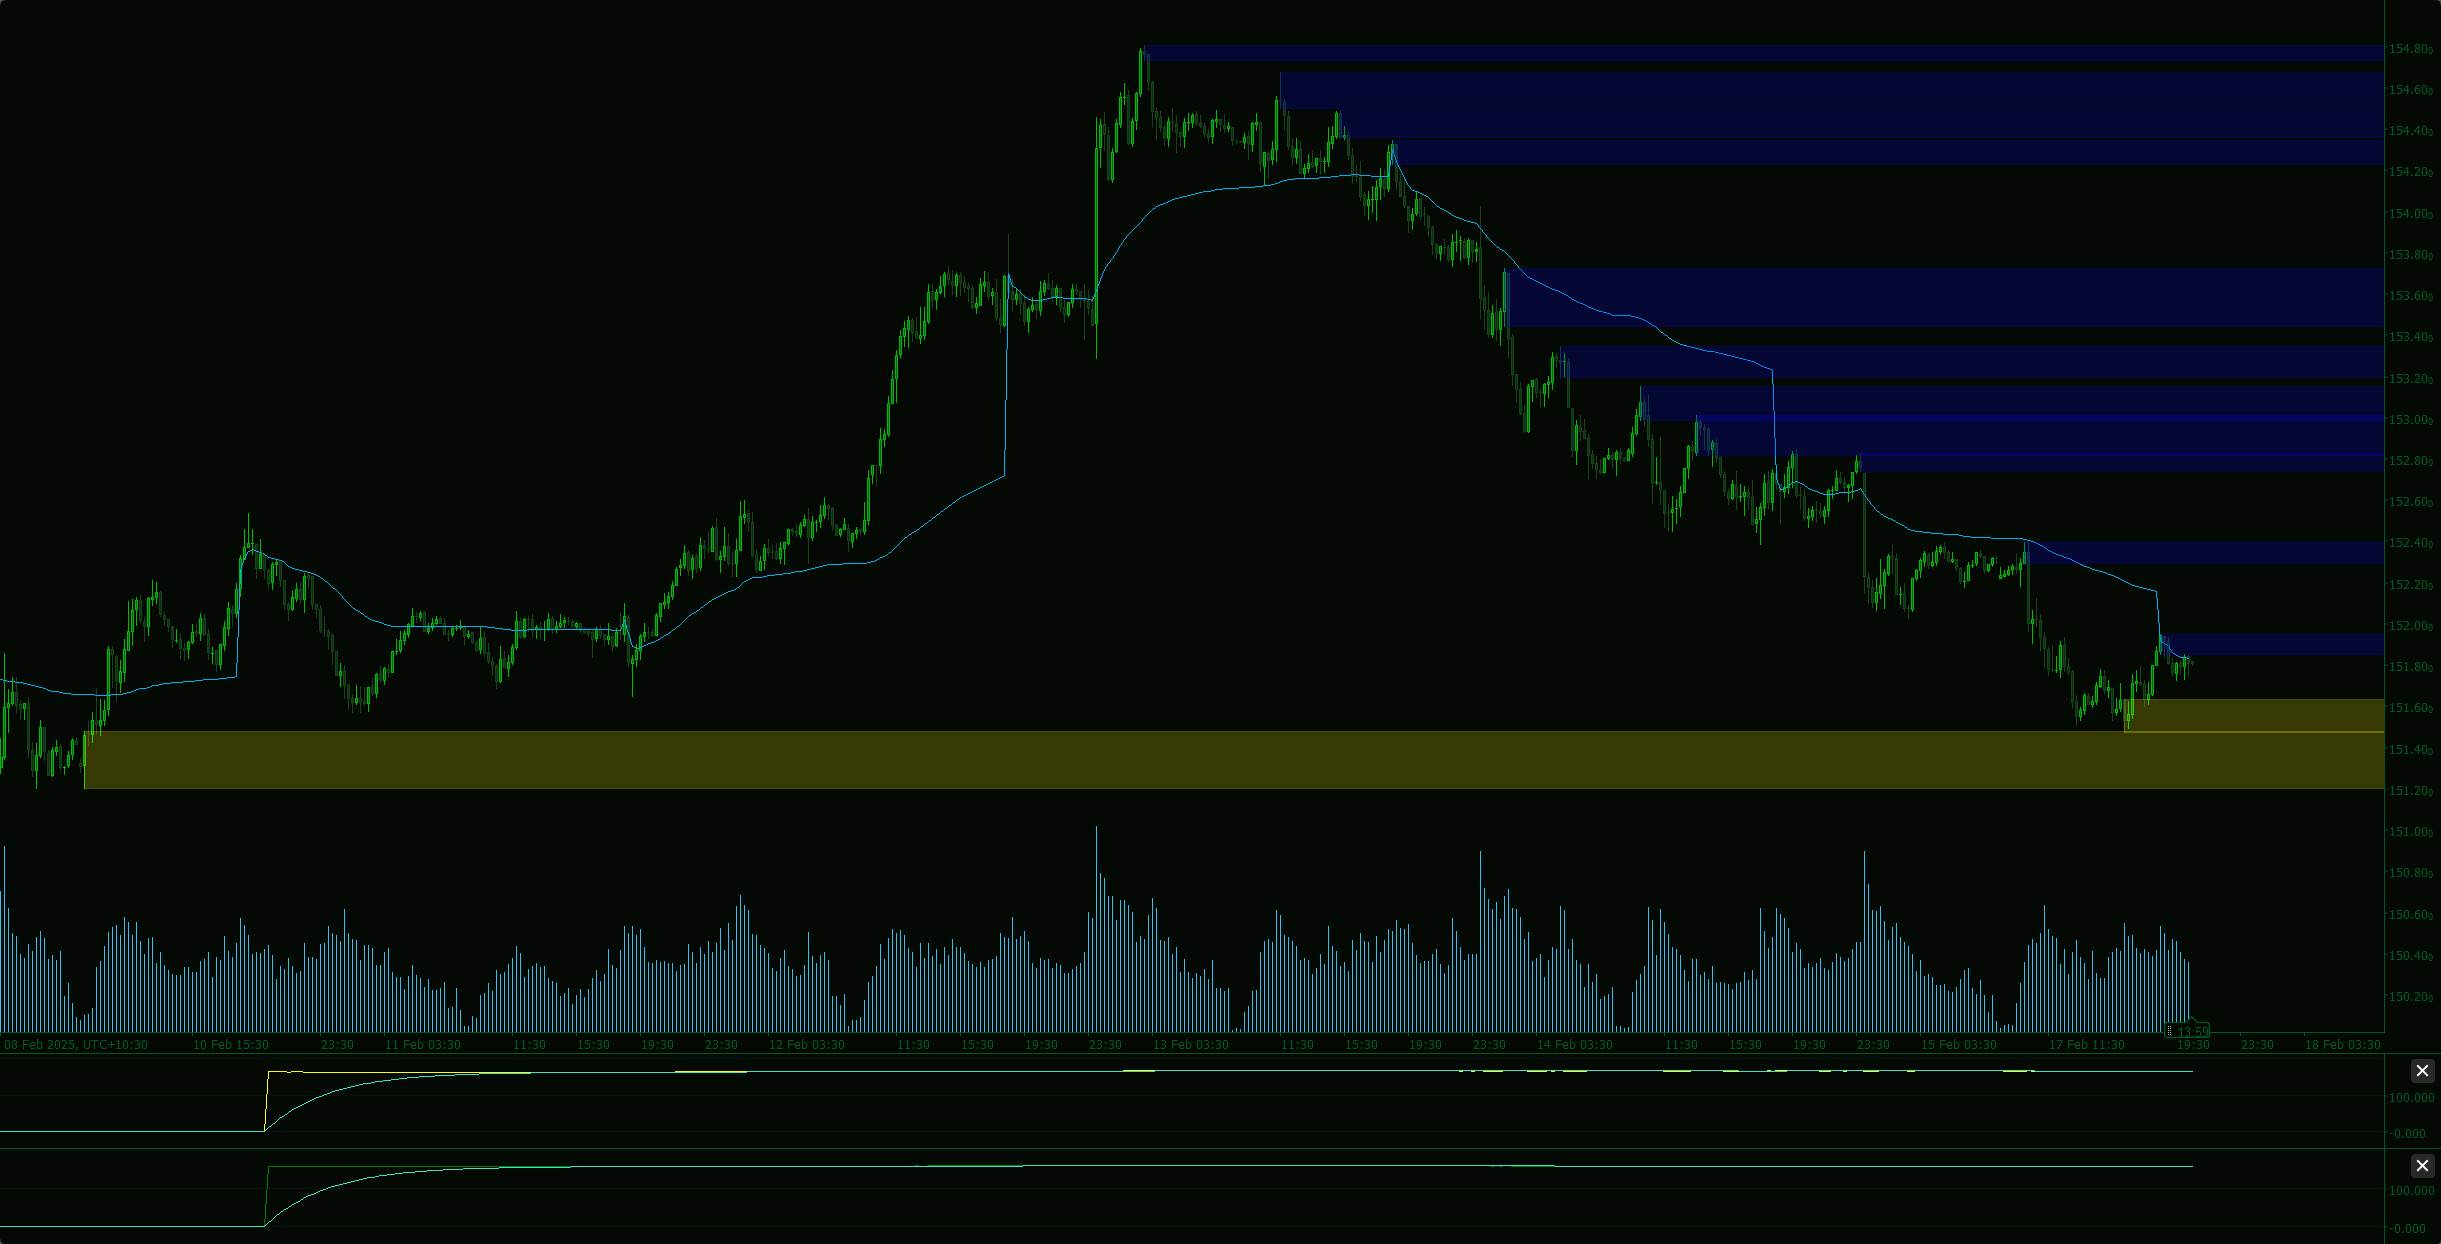
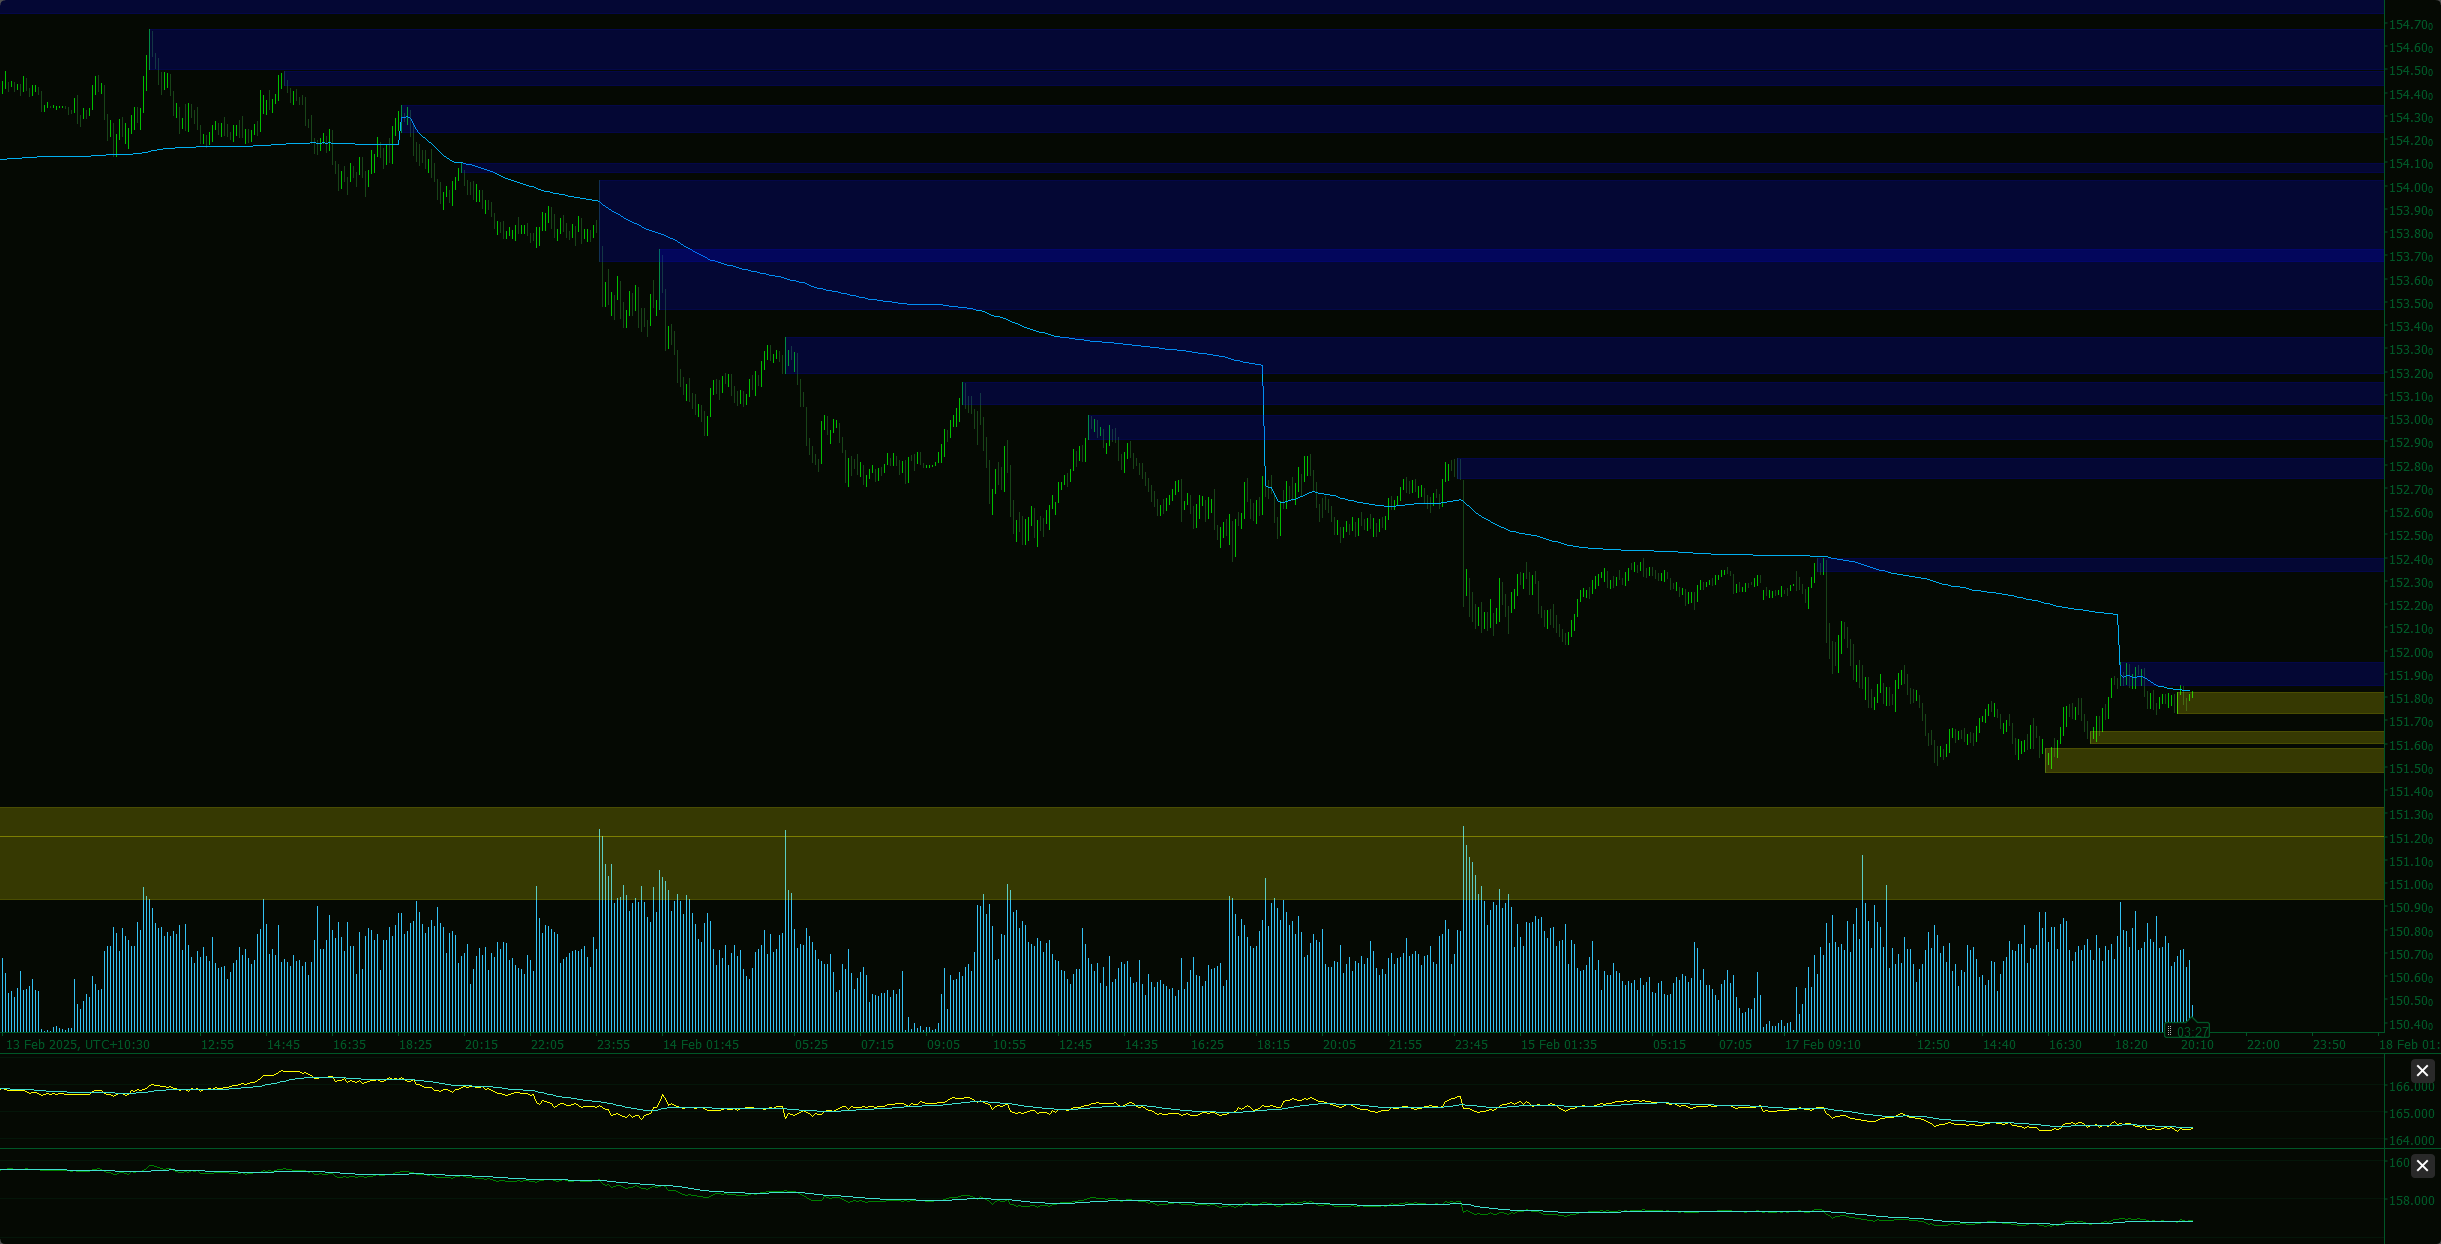
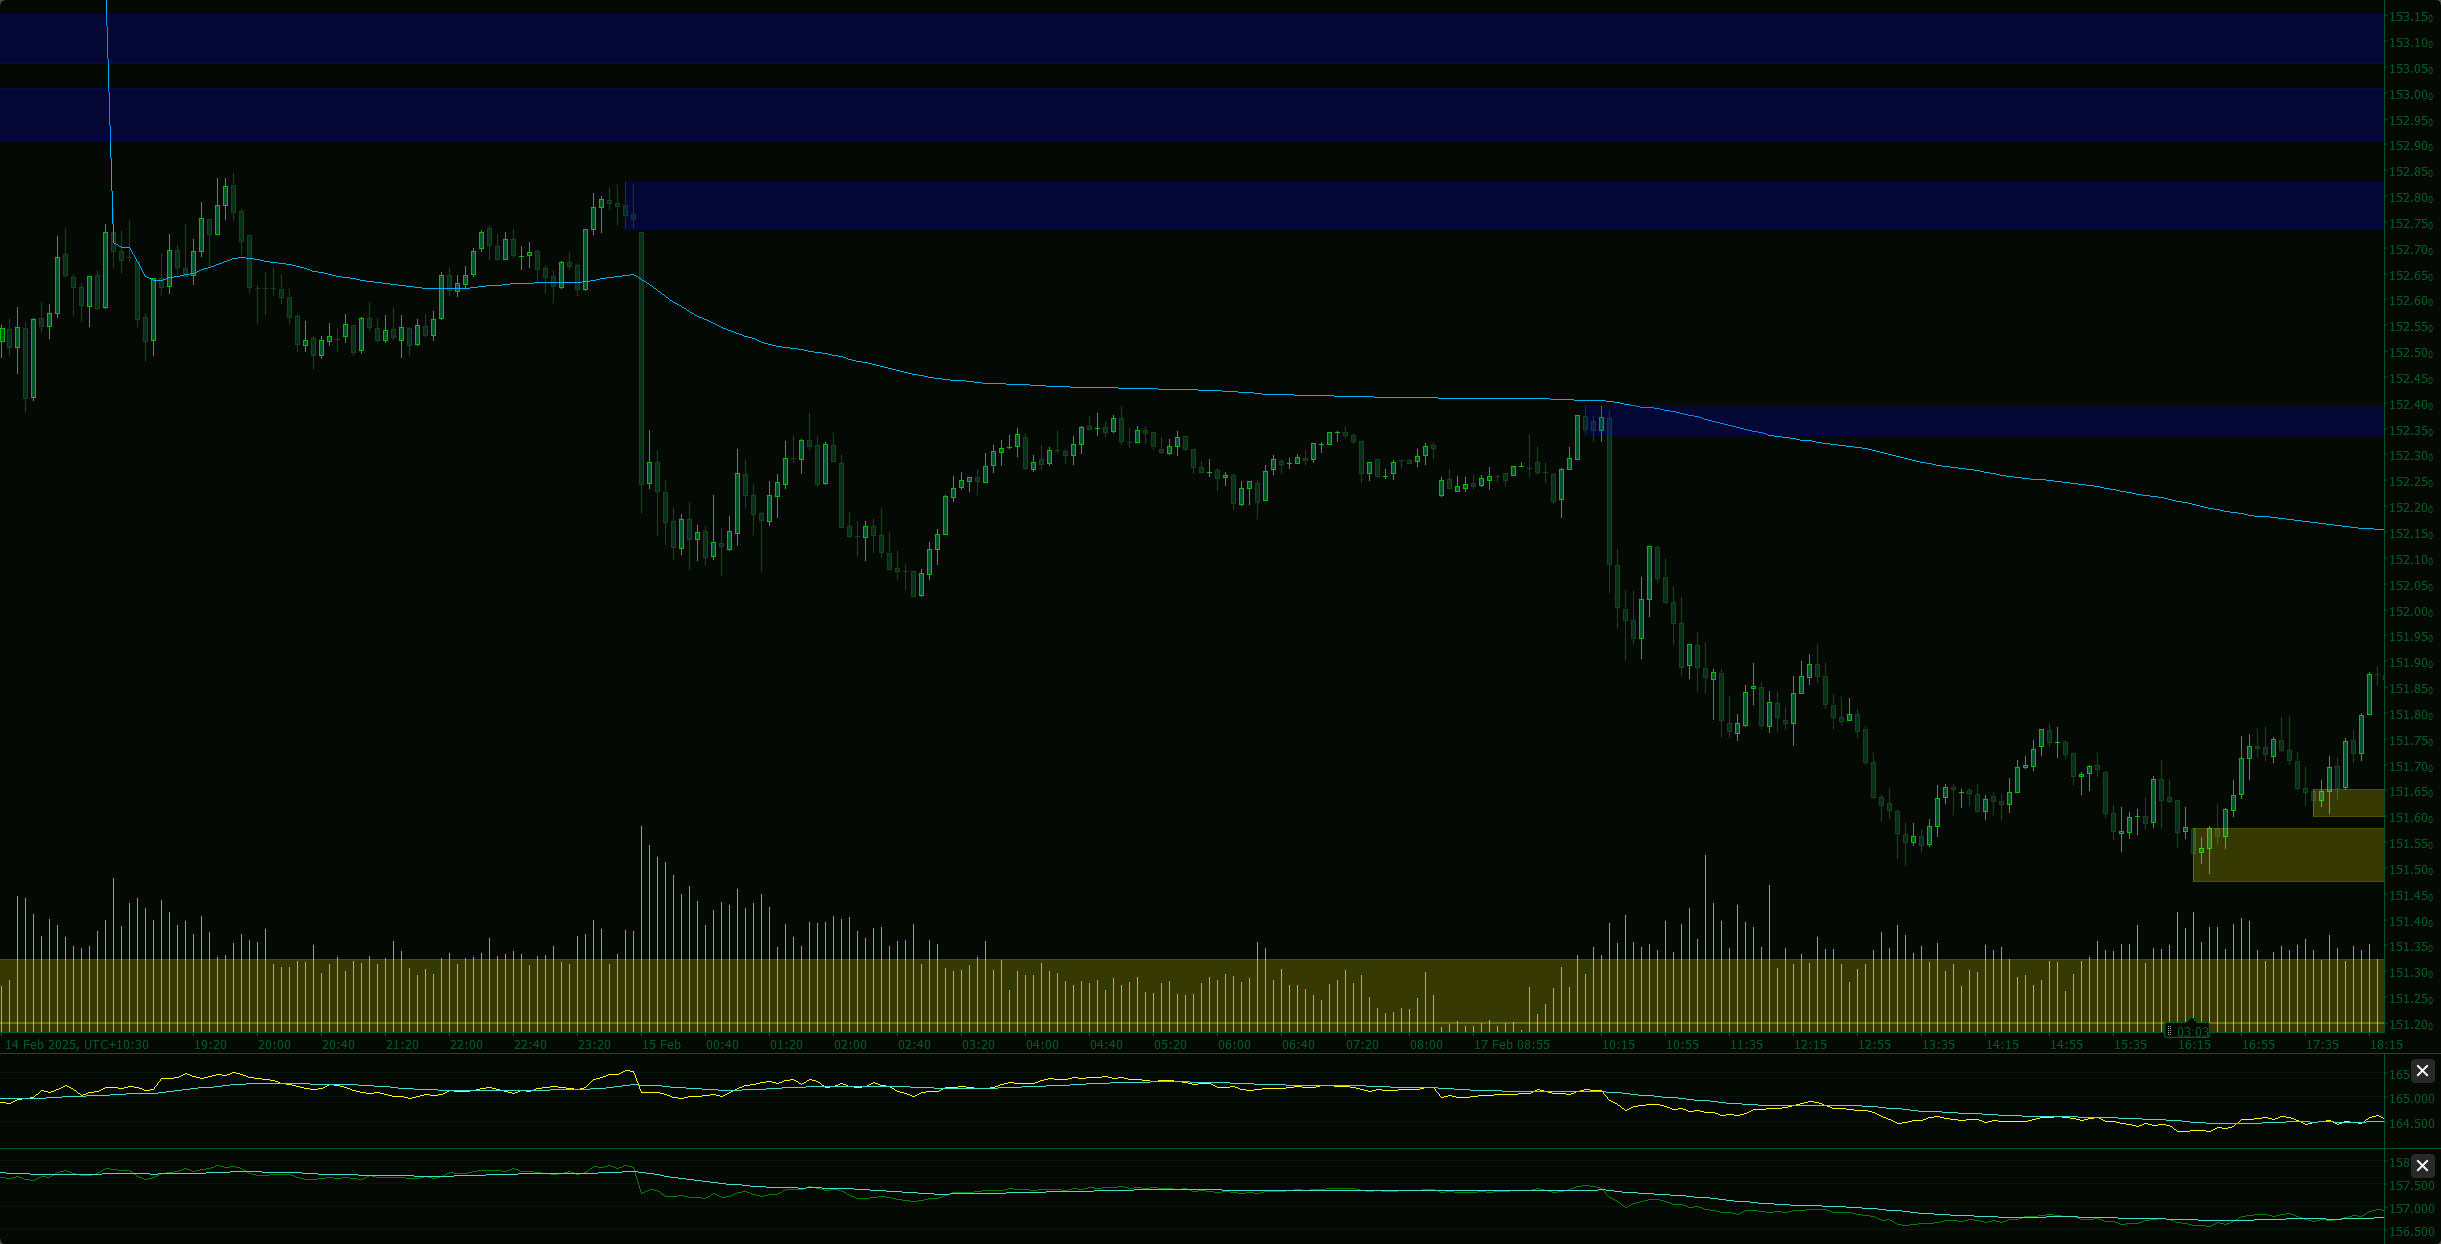
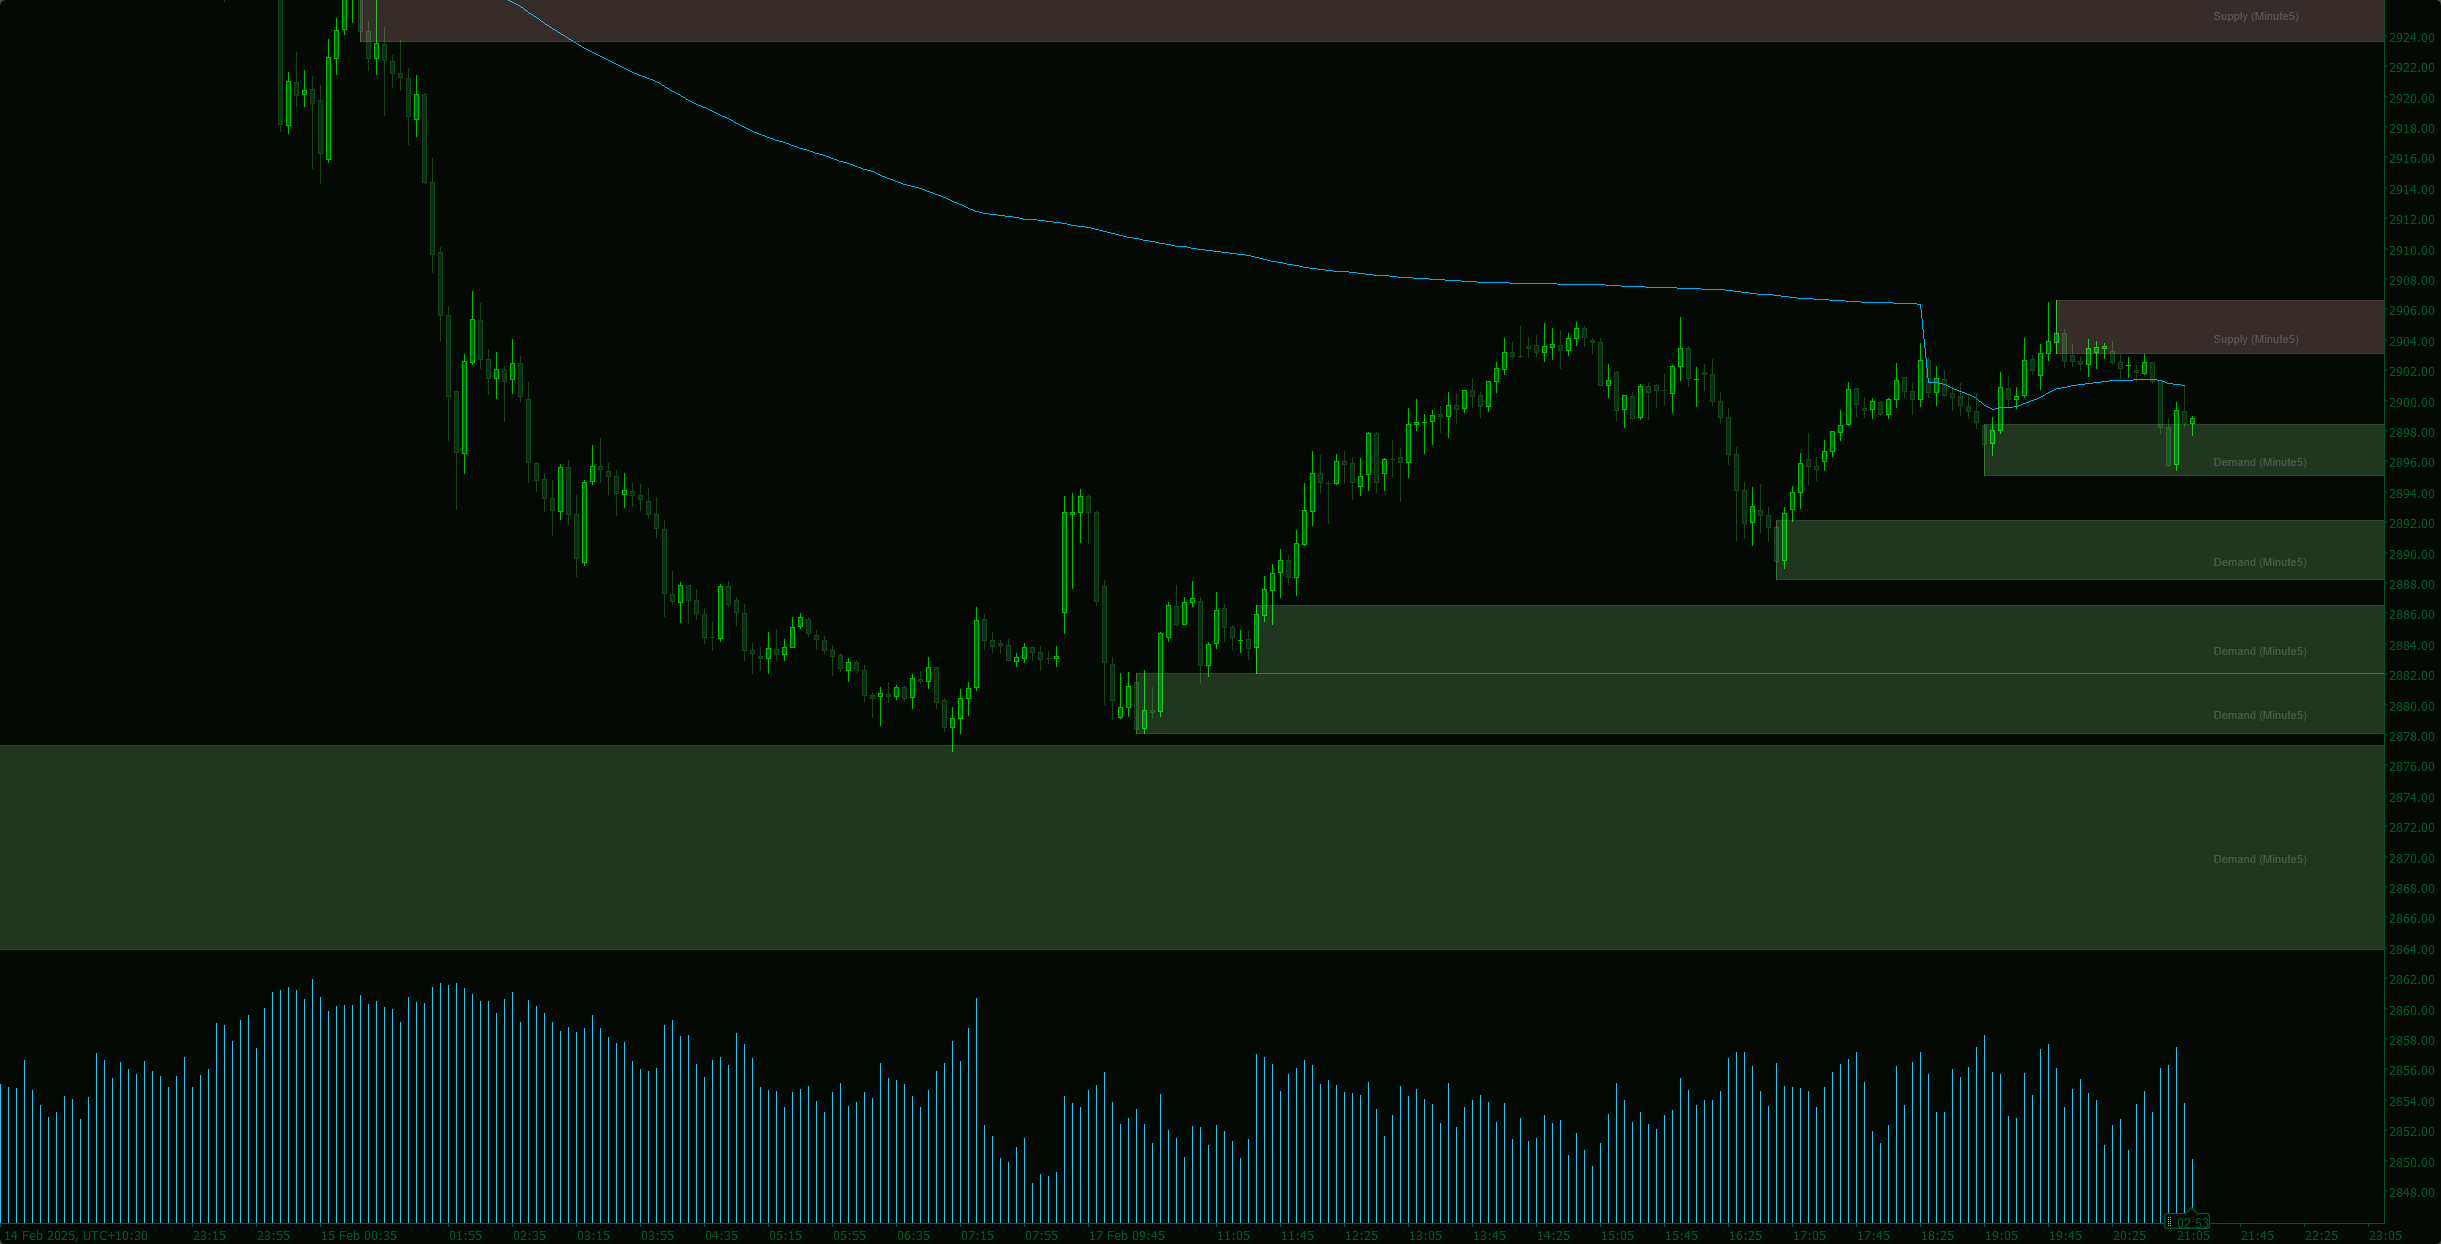
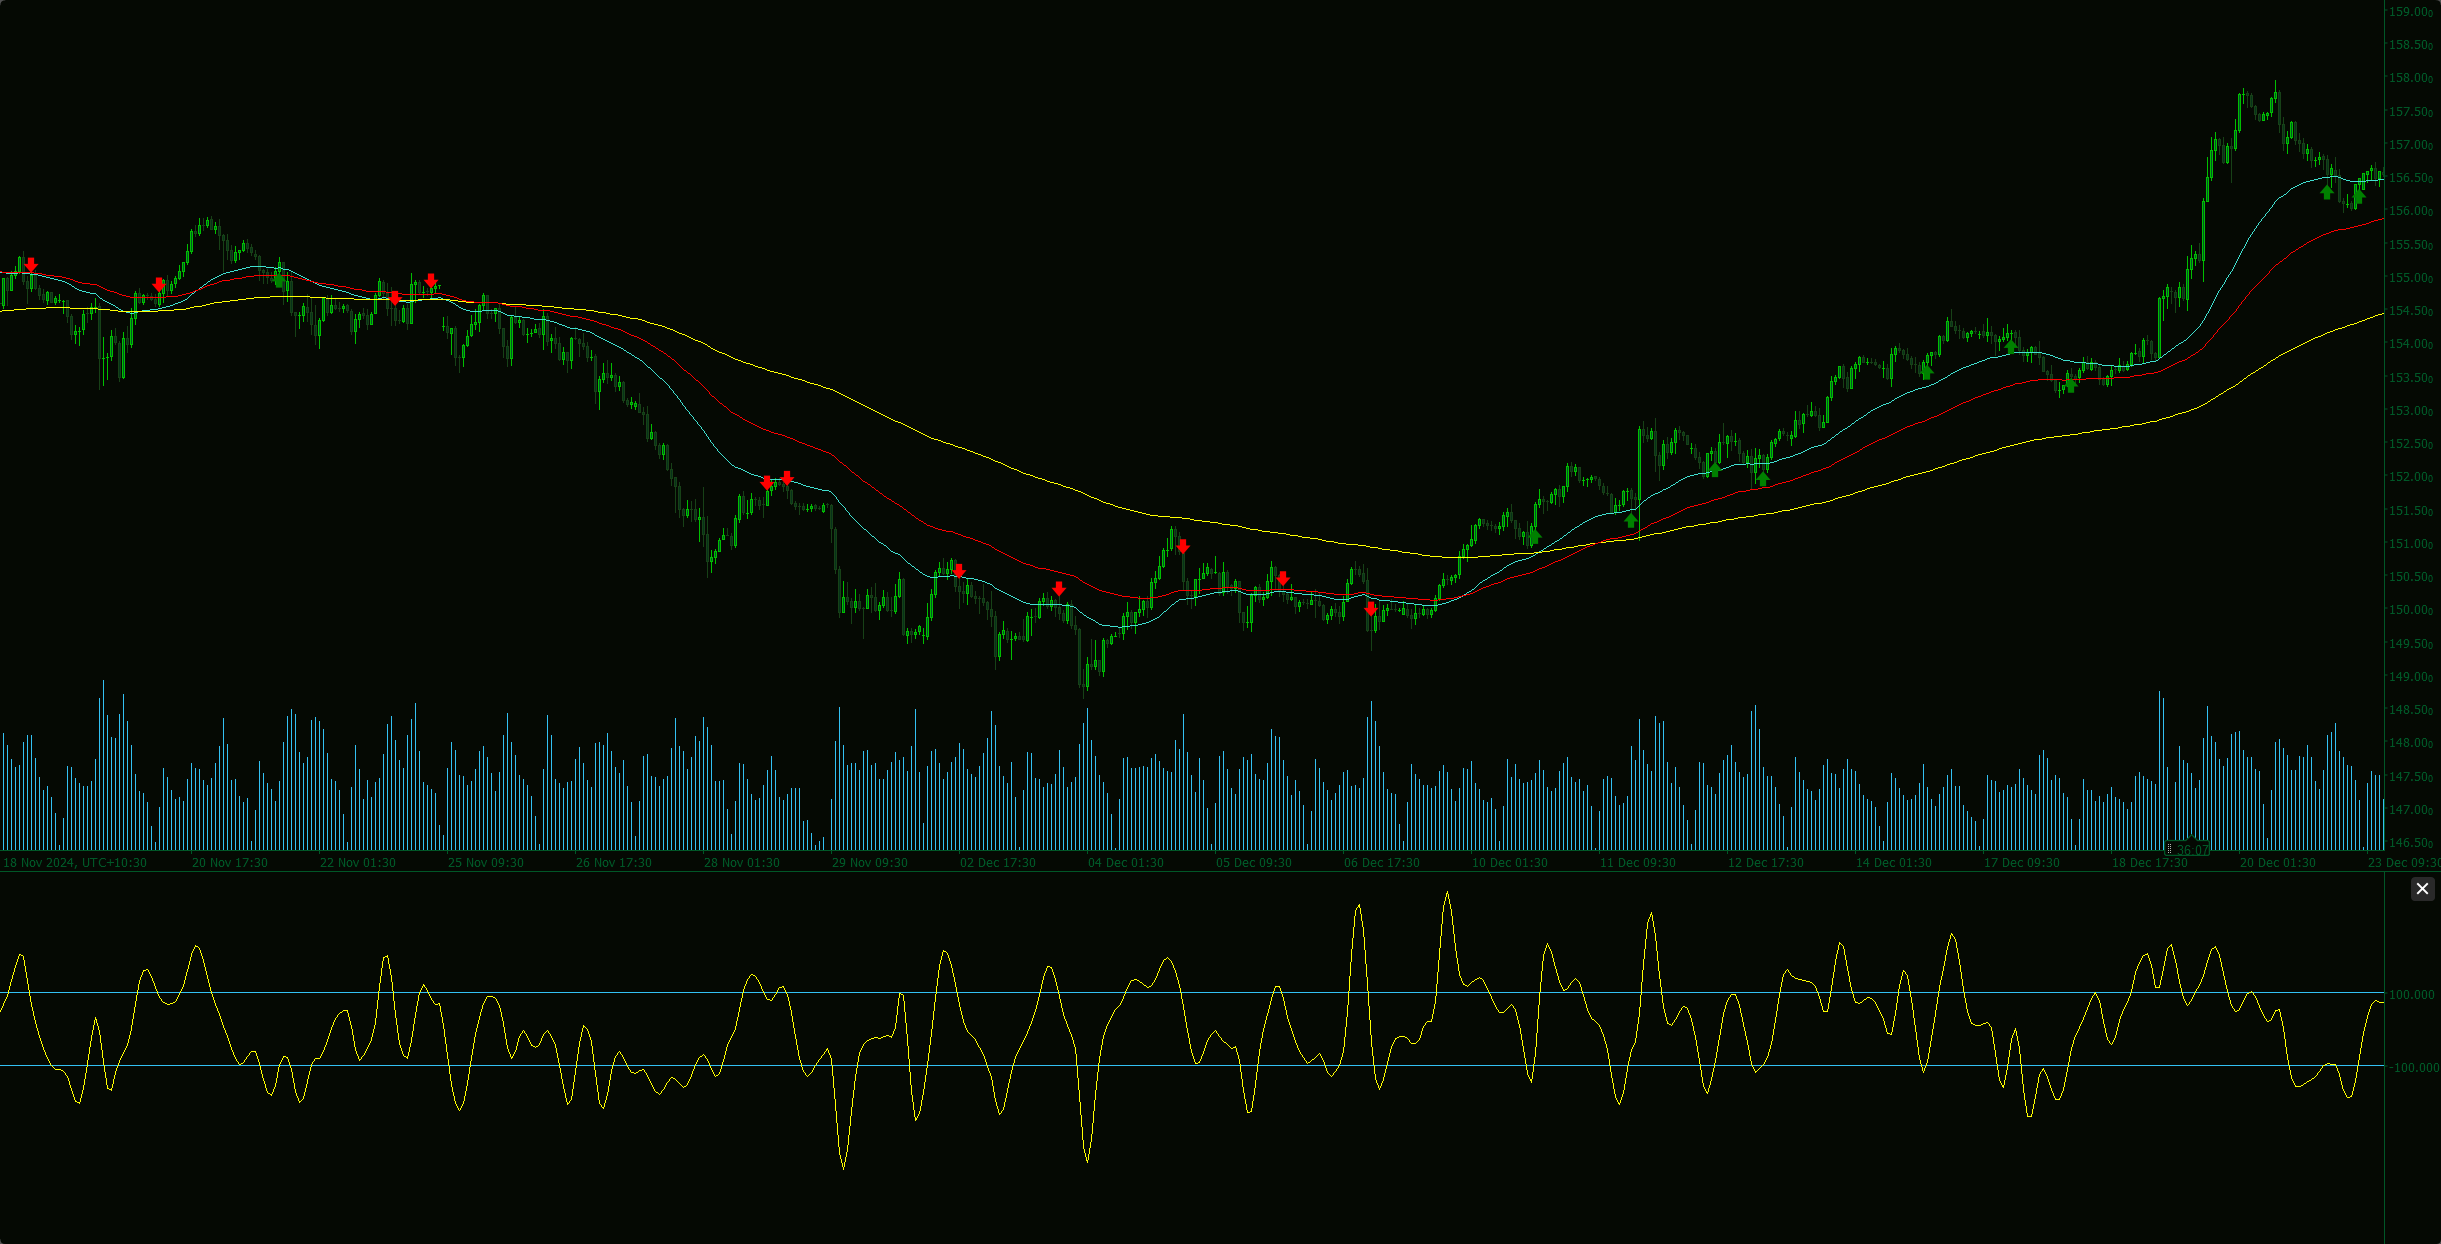
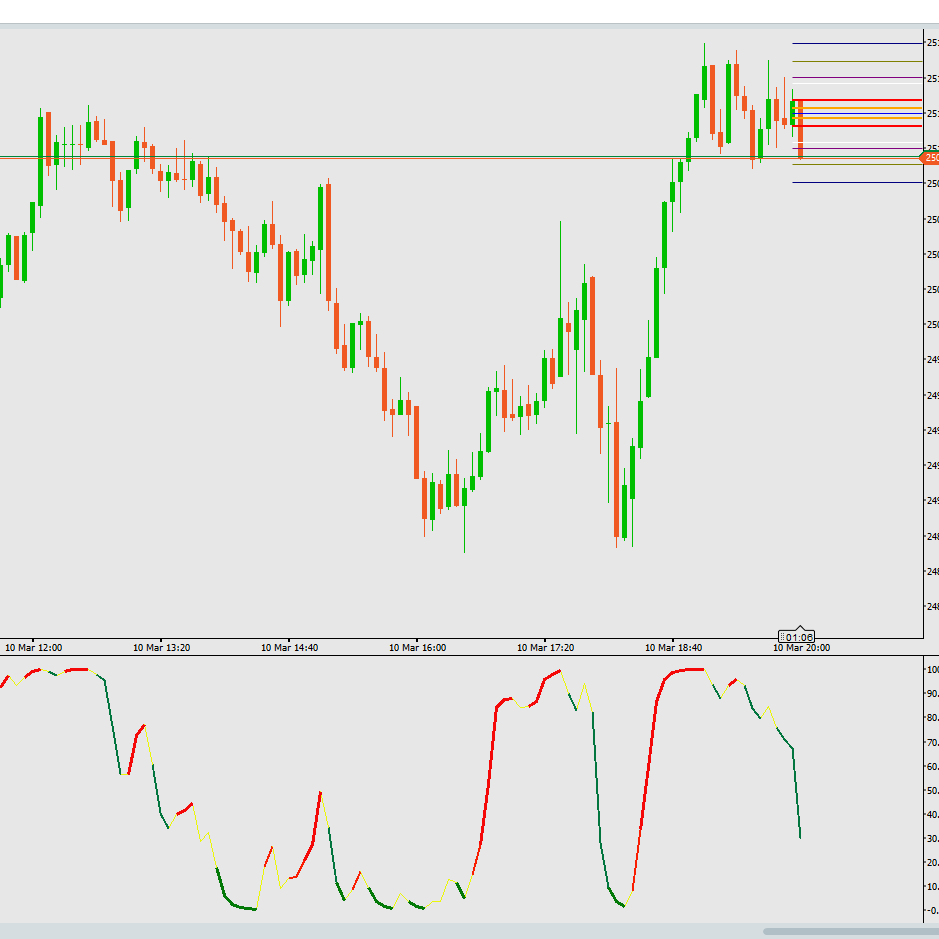
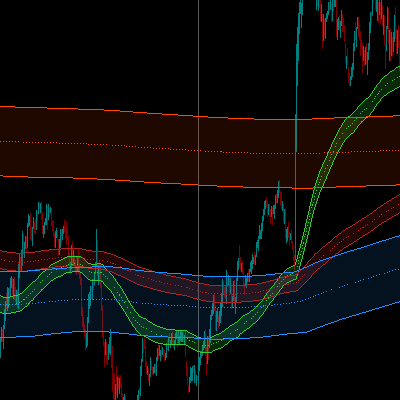
Identify High-Probability Trading Zones with Precision

Tired of manually drawing supply and demand zones? This advanced indicator does all the work for you, identifying key market areas where price is likely to reverse or consolidate. Designed for serious traders, this tool helps you trade with confidence by highlighting the most relevant zones in real-time.

Key Features:

5.0
Reviews: 3
5
100 %
4
0 %
3
0 %
2
0 %
1
0 %
Customer reviews
September 4, 2025
July 14, 2025
Pros: Clearly marks supply and demand zones. Customizable sensitivity and visual settings. Stable and light on resources. Cons: No alerts or tooltips. Lacks volume-based filtering and setting templates. Needs confirmation for trade signals.
May 6, 2025
Buen Indicador, Marca Zonas importantes ,, facilita la visualizacion y evita la marcacion manual por fallo del operador discrecional
More from this author
Indicator
Indices
Stocks
Commodities
+2
Market Sessions - Free
Track major trading sessions (Tokyo, London, New York) with customizable colors and visual sessions on your chart.
Supply Demand V1-Premium
Auto-detect supply & demand zones, remove broken levels, and trade smarter with real-time alerts. Precision made simple.
Market Sessions V2_NSC
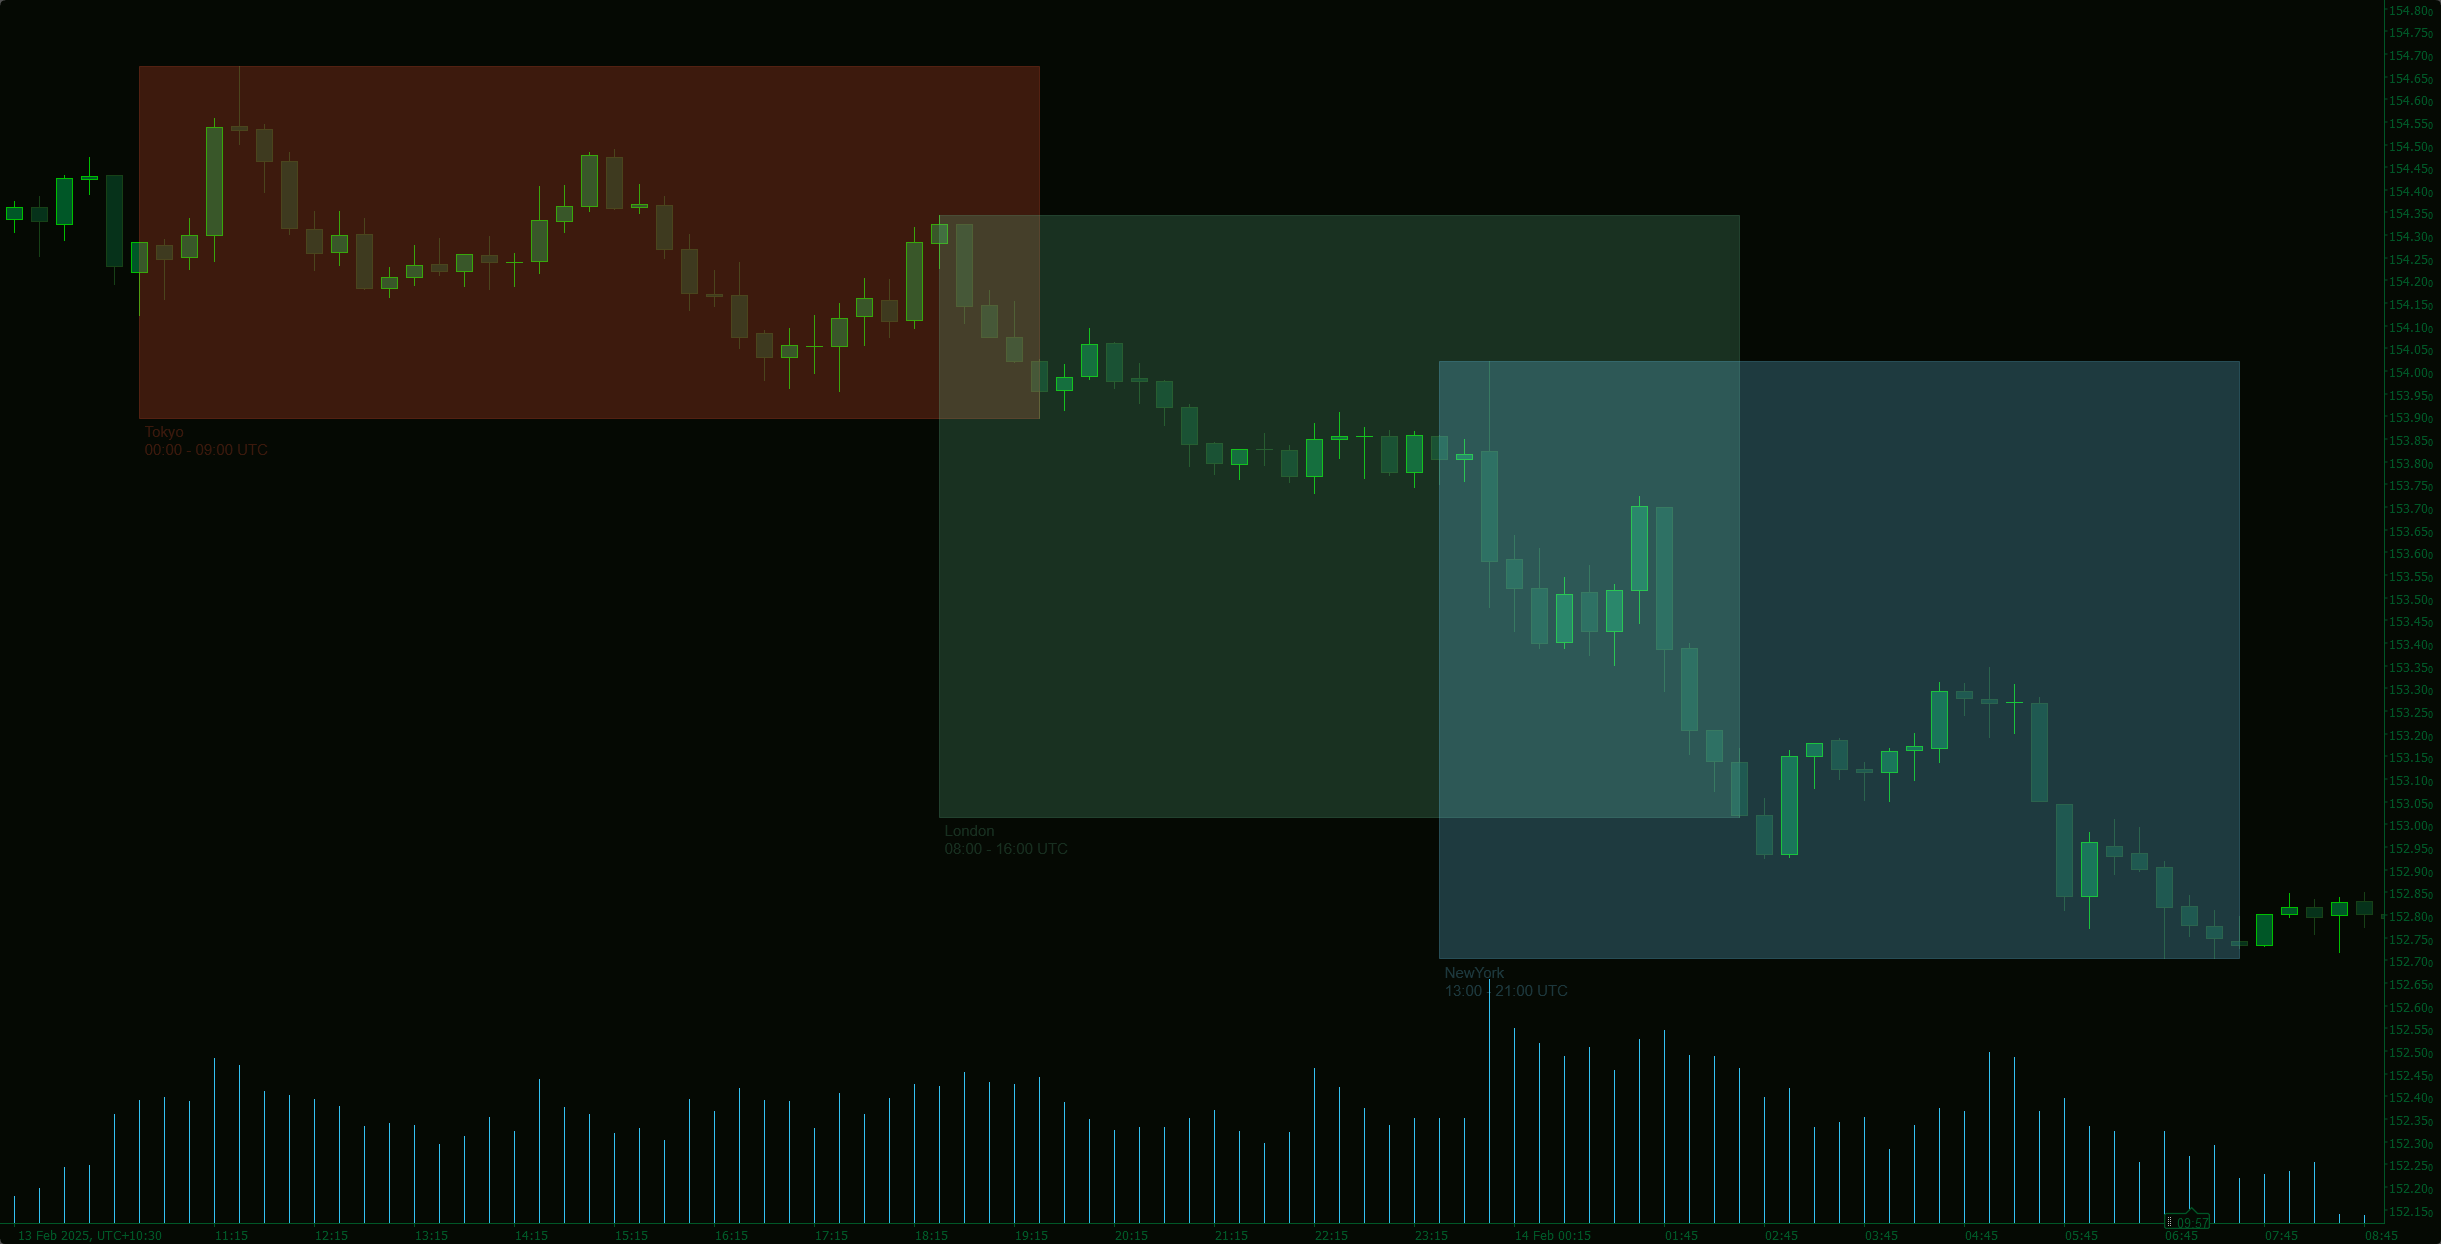
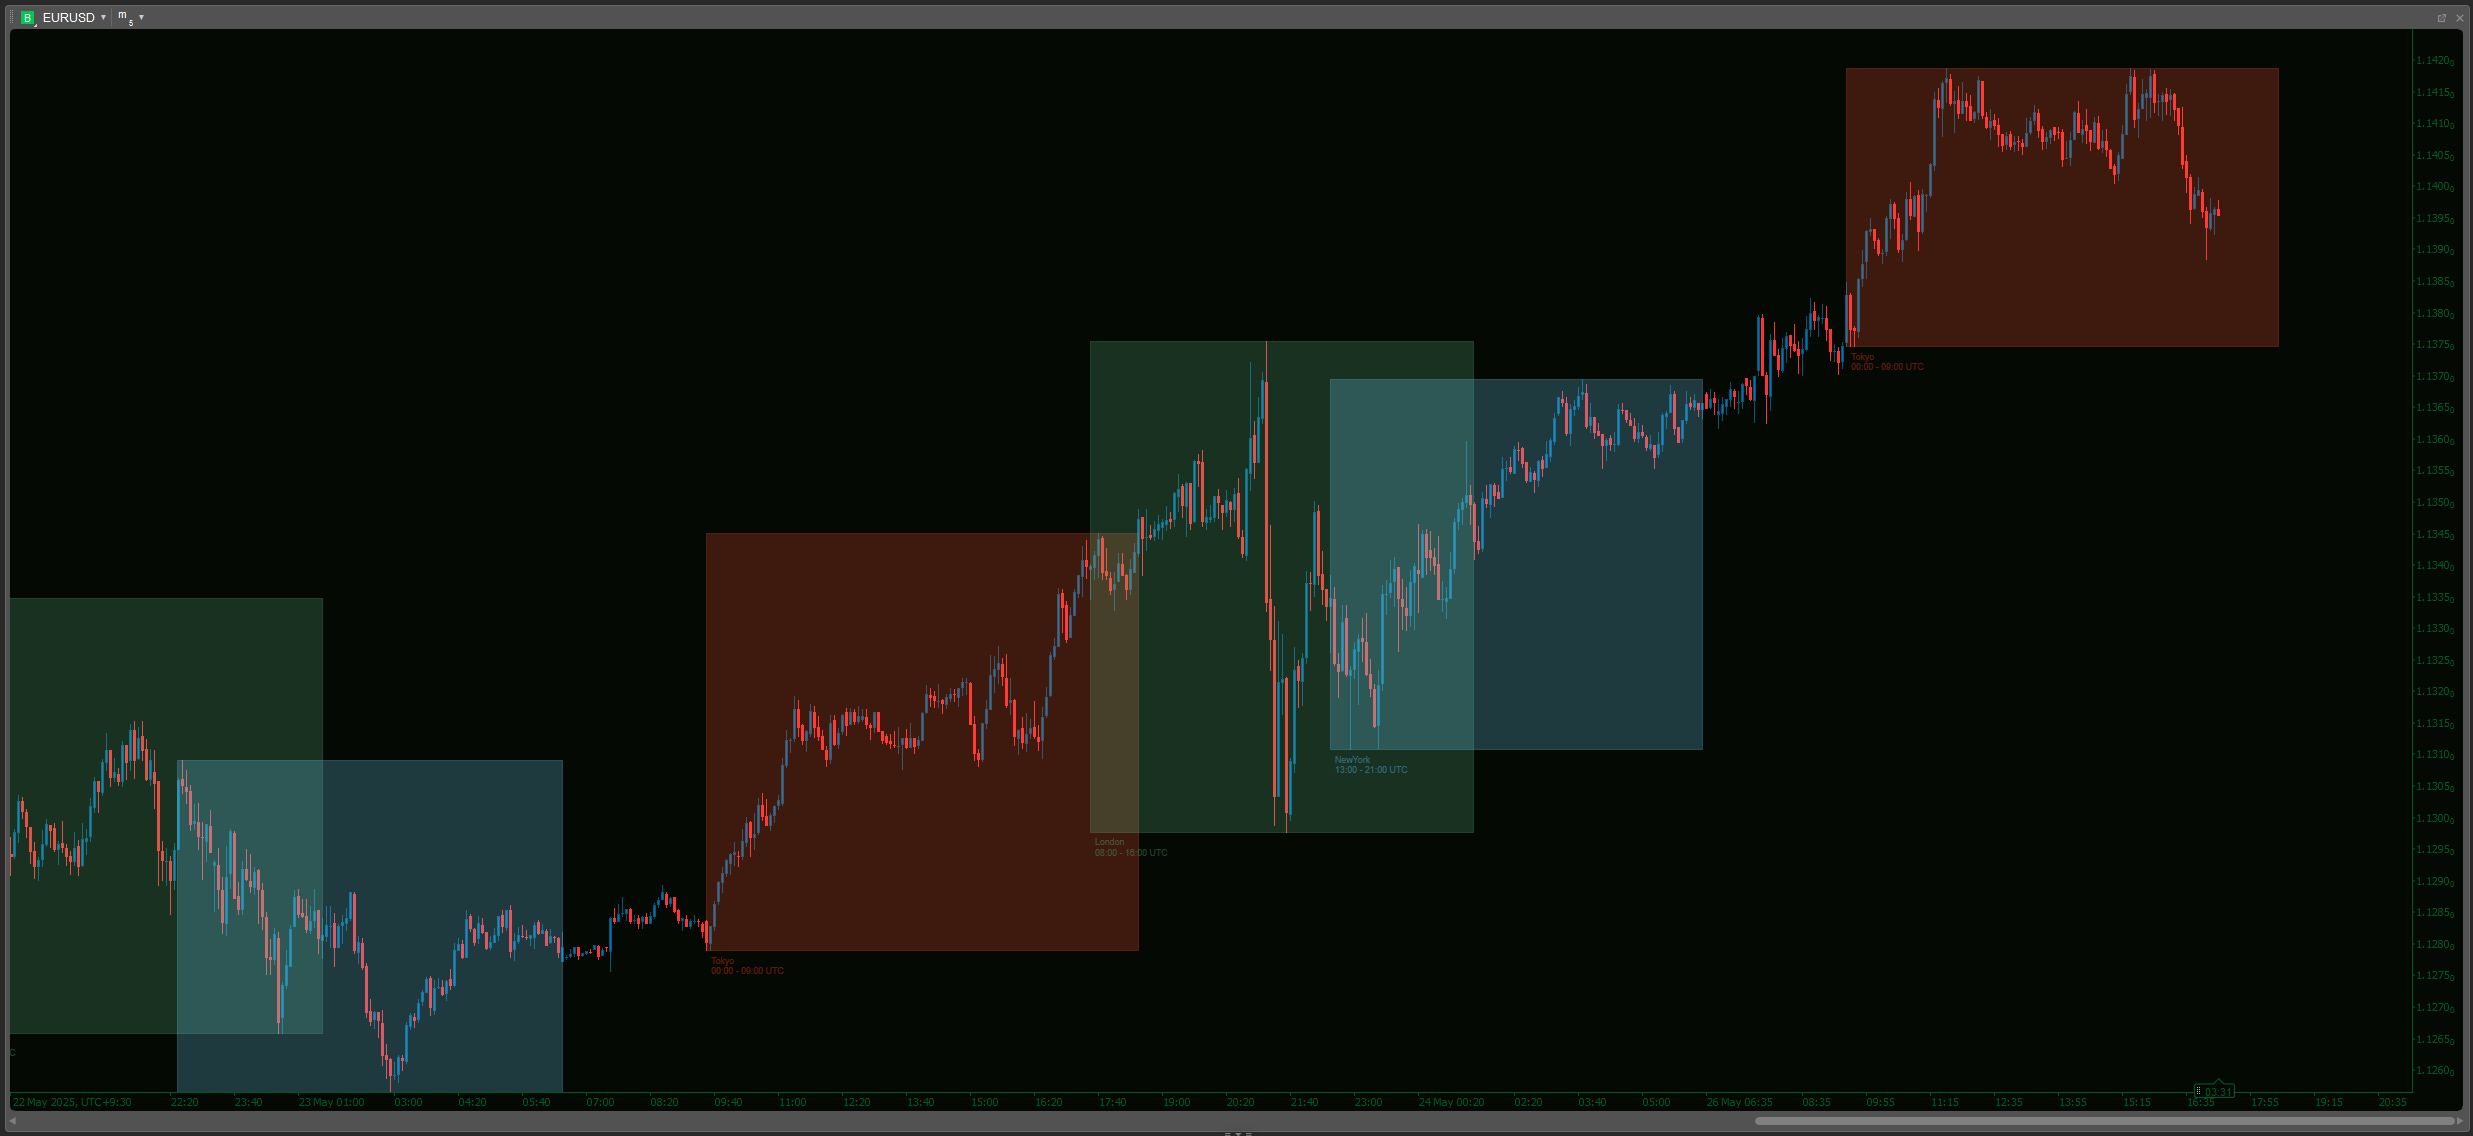
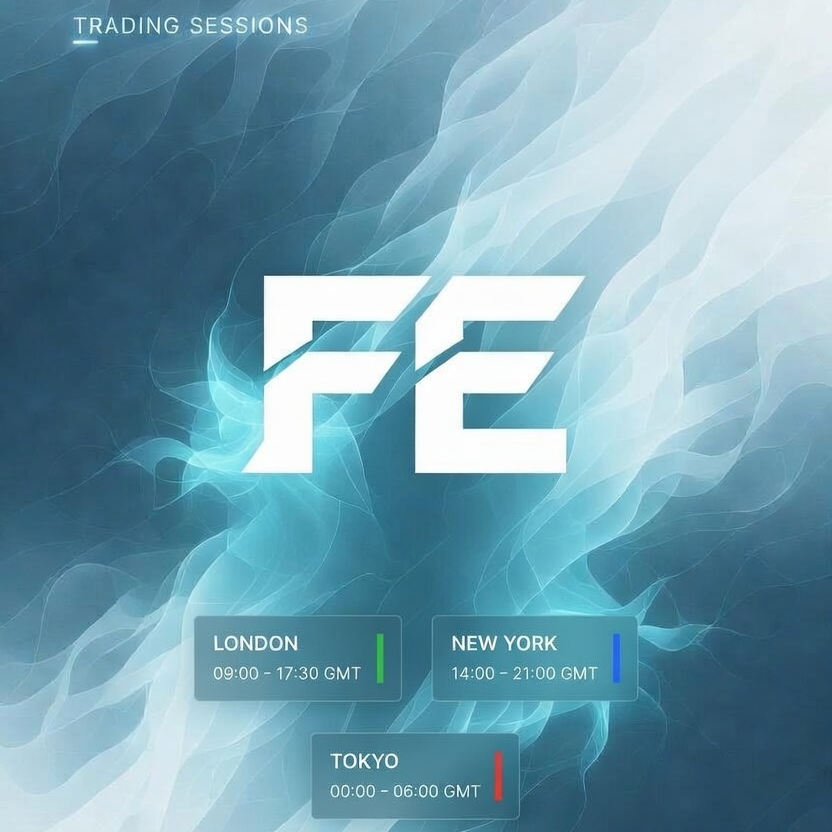
Market Session V2: Full Control. colors, history, session/text toggles, font size. Elevate your strategy!
MTF Candle Window - On Chart
The Multi-Timeframe Candle Indicator displays candles from multiple timeframes in one window, enhancing market analysis!
VWAP - London Open
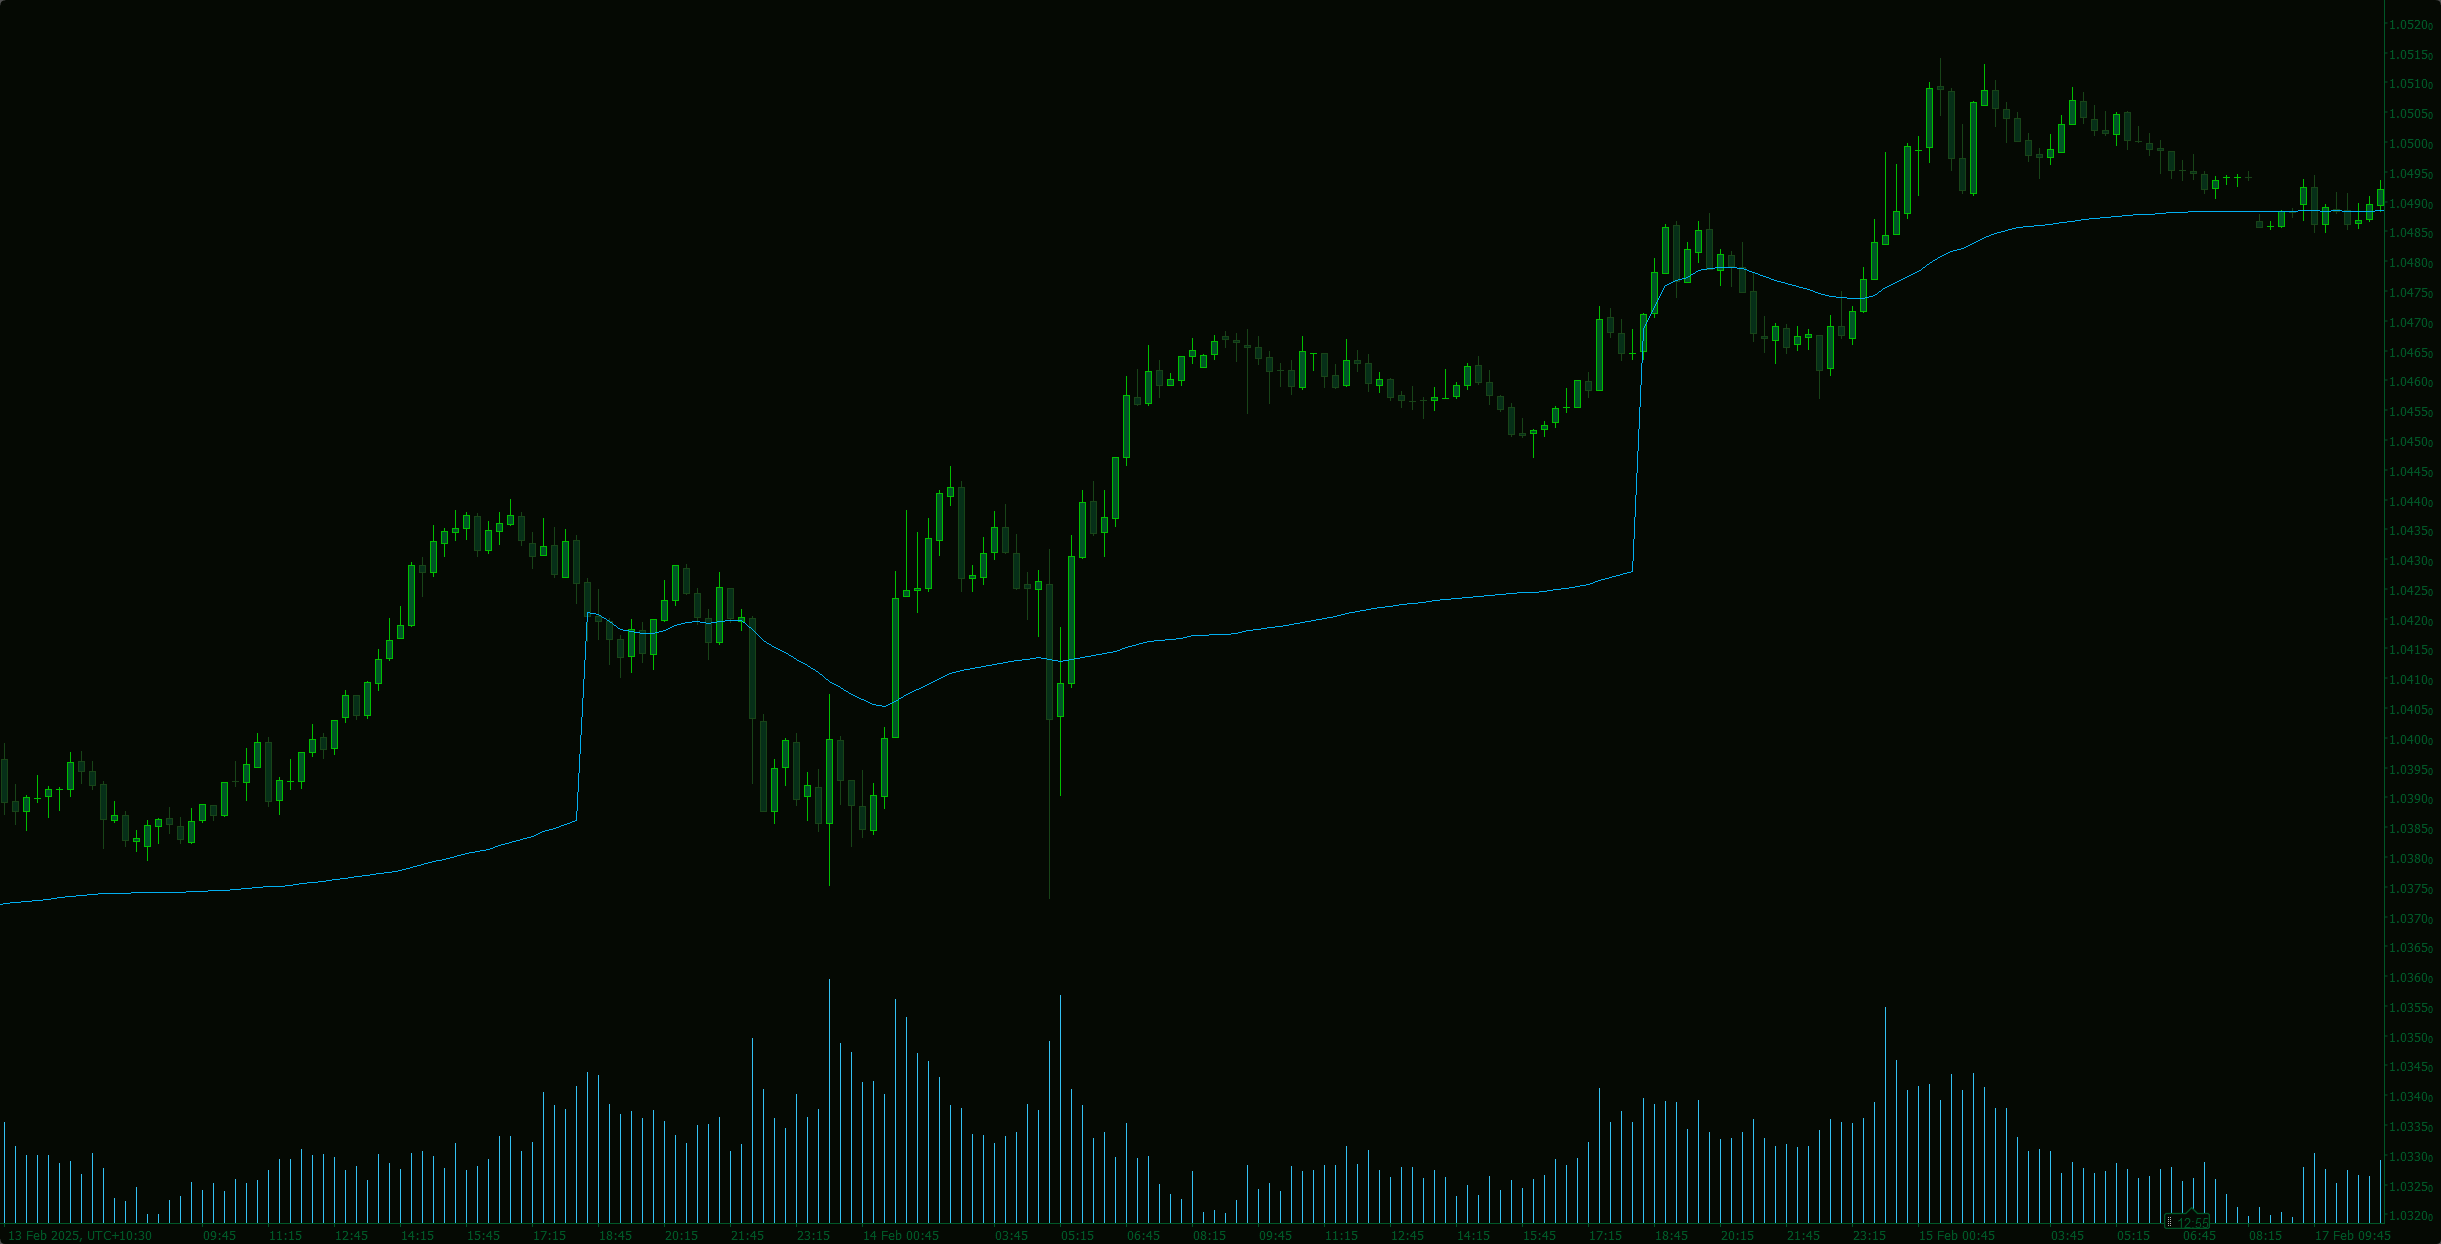
VWAP Set to London Open
Market Session V3_NSC
Version 3: Full control of session display including start and end times of all 3 sessions!
VWAP Tokyo Open
VWAP Set to Tokyo Open
MTF Candle Countdown
Stay ahead with a real-time countdown to candle closes on all key timeframes: 5m, 15m, 30m, 1H, 4H, and Daily.
Indicator
Indices
Forex
Signal
+2
US Dollar Index
US Dollar Index
Volume Profile Triple Line - POC Median Mode
The Advanced Volume Profile Indicator calculates POC, Median, and Mode, revealing key price levels for smarter trading.
Open Trade PipsV1
This indicator tracks the unrealised amount of pips in your open positions.
Commodity Channel Index Smoothed w Alerts_NSC
Smoothed CCI alerts! Audio & arrow signals for +/-100 crosses. Custom sounds & arrow filters. Precision trading!
Open Trade ProfitV1
A simple indicator that tracks the value of your open trades in pips.
Indicator
NZDUSD
Forex
USDJPY
+1
8 Currencies_NSC
RCS: 8 majors! AUD,USD,EUR,JPY,GBP,CAD,CHF,NZD. Find how strong each currency is relatively and trade smarter!
Indicator
Indices
Forex
EURUSD
+1
DXY w HMA
DXY HMA Indicator
Supply Demand Premium V2_NSC
The long awaited new and improved Supply Demand Premium V2 indicator. Unlock greater trading opportunities now!
Indicator
Forex
Signal
USDJPY
Yen Strength - Line Momentum
Single-line JPY Strength Indicator: Track yen momentum swiftly across key pairs—achieve clarity in your forex trades!
Indicator
Indices
Commodities
CCI - With Arrows and 40 80 EMA Logic_noSourceCode
The Advanced CCI & EMA Indicator combines the CCI with 40 & 80 EMA logic to generate precise arrows signaling direction
You may also like
Indicator
Signal
FAMA-MAMA
The FAMA-MAMA Indicator is a powerful, adaptive trend-following tool designed for professional and algorithmic traders.
Indicator
Bollinger
E7 Indicators Free Studies
ADXR, KDJ, SineWave, Bollinger Band Volatility and AEOscillator.
Session Highlight Framer
Frame the sessions
EMA_RTH
Custom period EMA
Auto Fibonacci Retracement
Auto Fibonacci Retracement Indicator for cTrader
Indicator
Grid
RSI
XAUUSD
+12
PFO Price Flow Oscillator
technical analysis tool designed to provide traders with a structured view of market momentum and volatility
Indicator
Breakout
Round Number
Plots automatic psychological levels at round-number zones – major structure & liquidity levels.
Indicator
NAS100
NZDUSD
Breakout
+14
Bollinger Bands Cloud
Visualize Bollinger Bands with a colored cloud for clarity. Enhance your trading precision with this dynamic indicator!
Indicator
NAS100
NZDUSD
Breakout
+14
Adaptive Trailing System
🚀 Adaptive trailing stop that uses logarithmic normalized volatility....
Previous Day Liquidity Zones (PDH - PDL)
Useful indicator for traders who want to visualize key price levels based on previous daily highs and lows.
Indicator
NAS100
NZDUSD
Martingale
+26
Trend & Volume Regime Map
Trend & Volume Regime Map – A normalized price & volume regime map for cTrader that scores trend from –10 to +10, colors
Indicator
NAS100
Indices
NZDUSD
+9
Heatmap Pro
Heatmap Pro analiza la volatilidad, el volumen y la acción del precio para "pintar" tu gráfico con zonas de color.
Indicator
NAS100
Indices
Prop
+3
session indicator
📈 Trading Sessions Indicator — London, New York & Tokyo Visualize Key Market Sessions + High/Low Levels with Precision
Indicator
Indices
RSI
Signal
+2
[Stellar Strategies] Ultimate Trend & Momentum Dashboard
A comprehensive cTrader indicator designed to give you a quick, at-a-glance understanding of market sentiment 📈📉
NNFX TP AND SL V1.1
A lightweight cTrader indicator that overlays ATR-based SL and TP levels in pips directly on your chart
VegaXLR - Fibonacci Bands
Customizable Dynamic Fibonacci Channels and Smart Alerts
Chaikin Money Flow
Chaikin money flow's primary purpose is to distinguish between periods of accumulation and distribution of a security.
HTFBB
Plot higher-timeframe Bollinger Bands for clearer structure, pullback zones, and breakout signals—without switching char