
Description
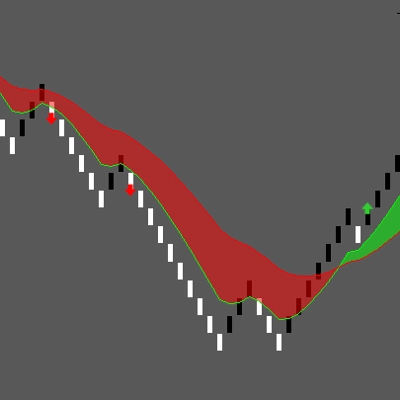
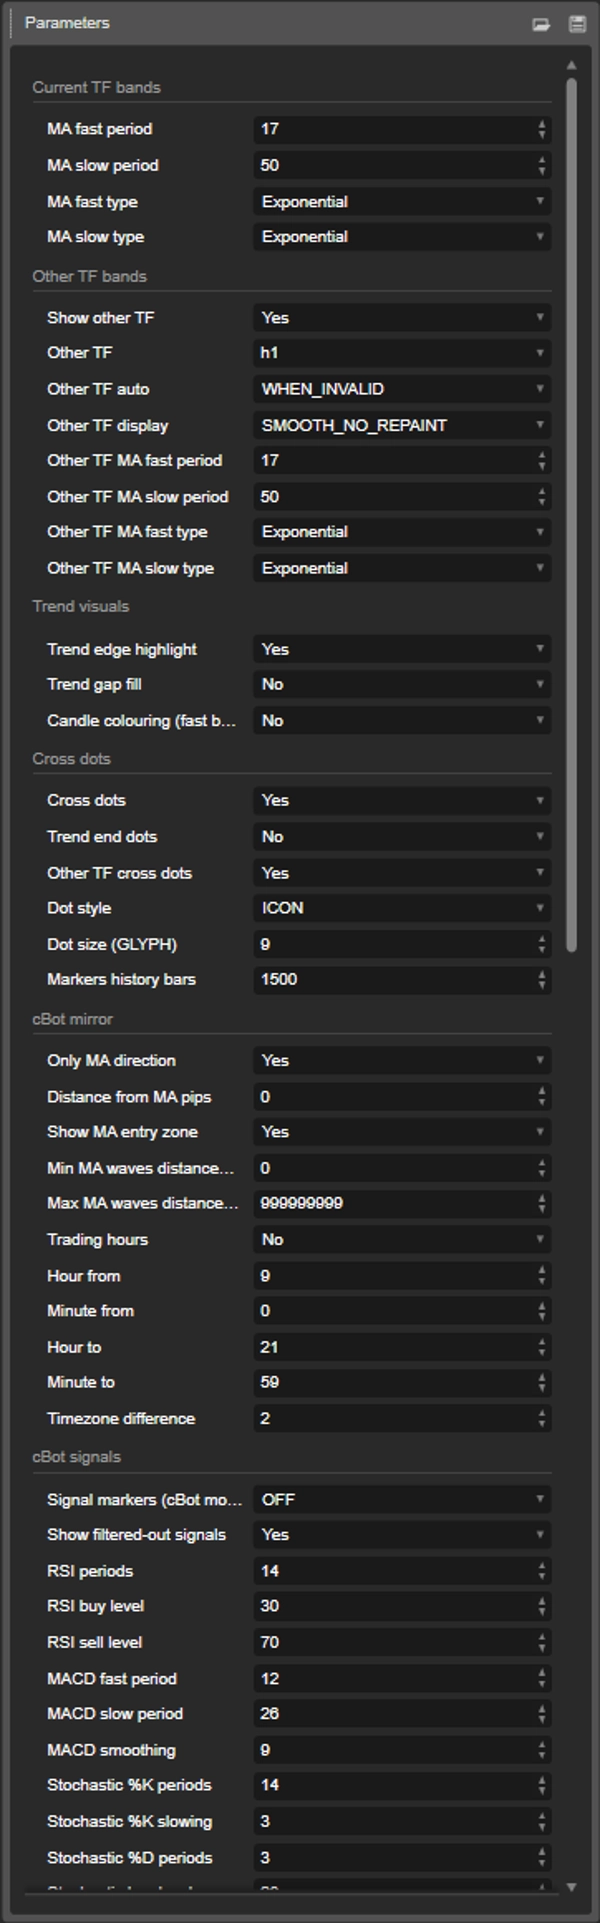
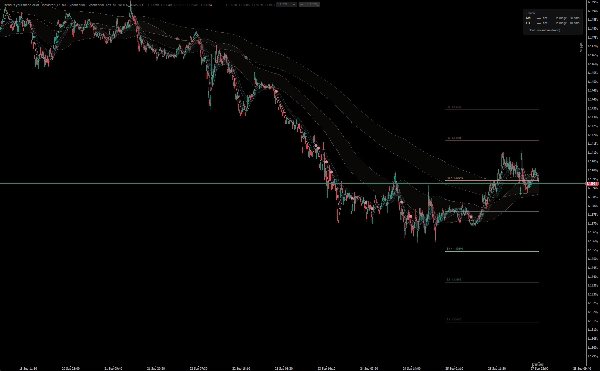
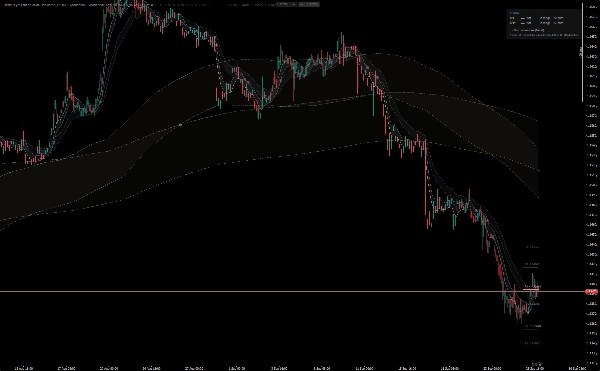
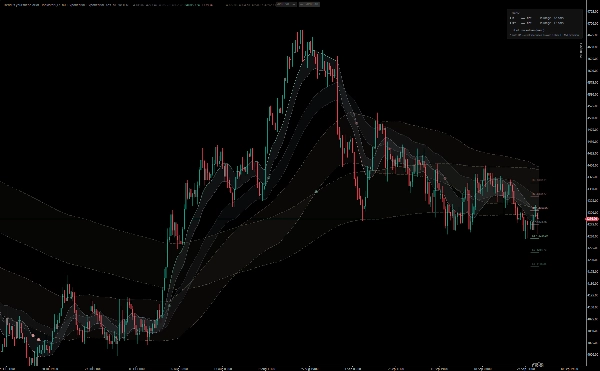
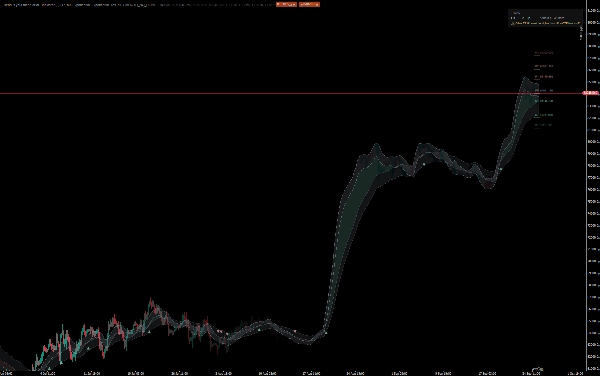
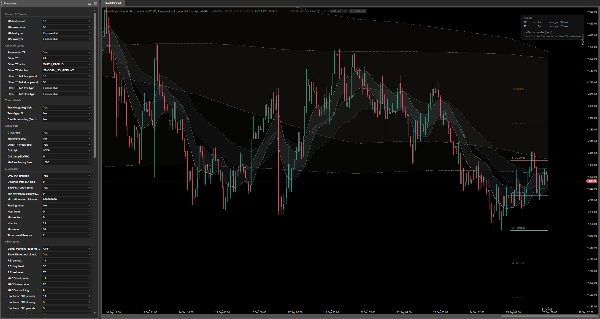
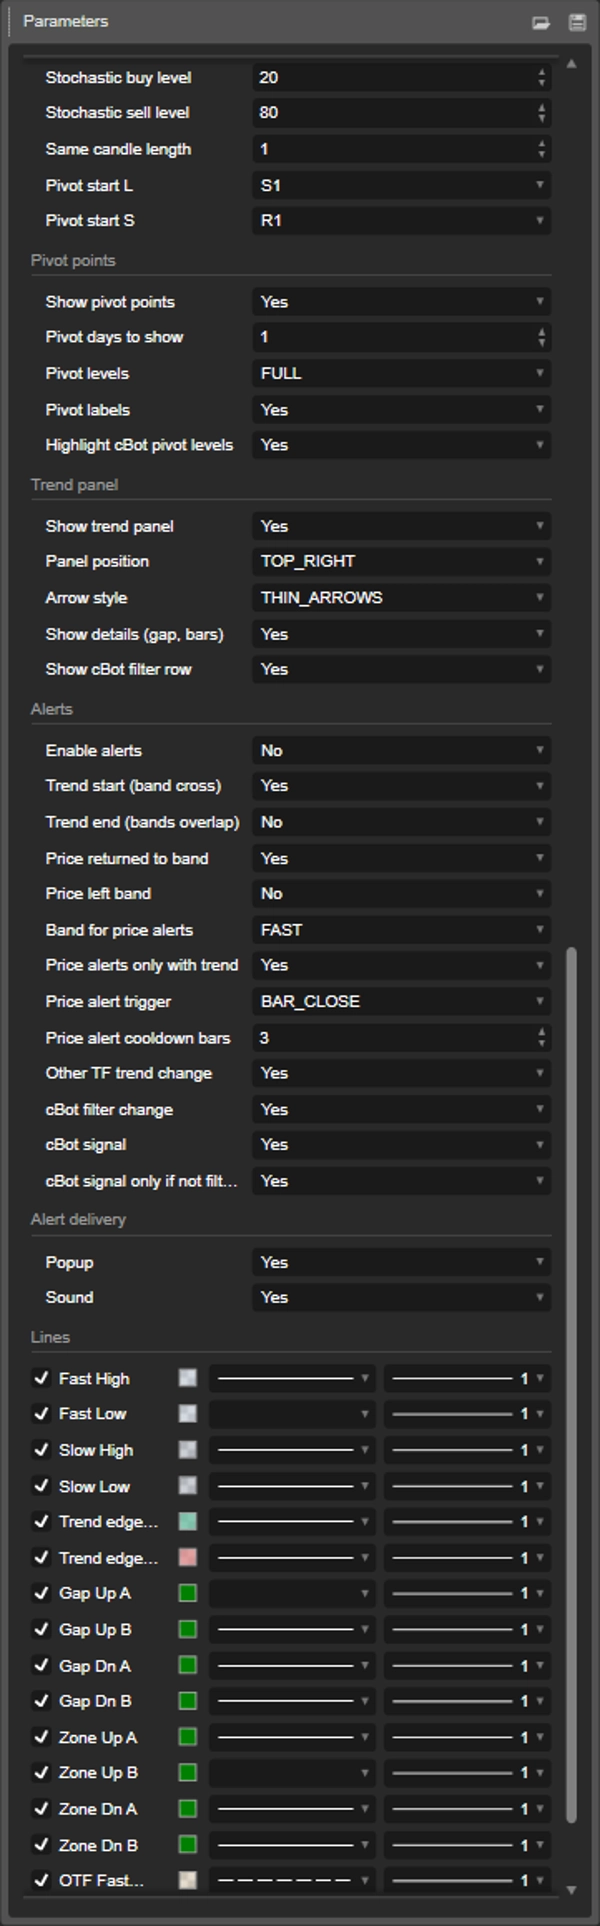
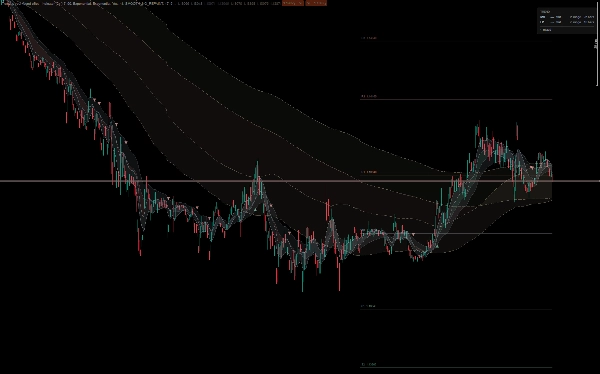
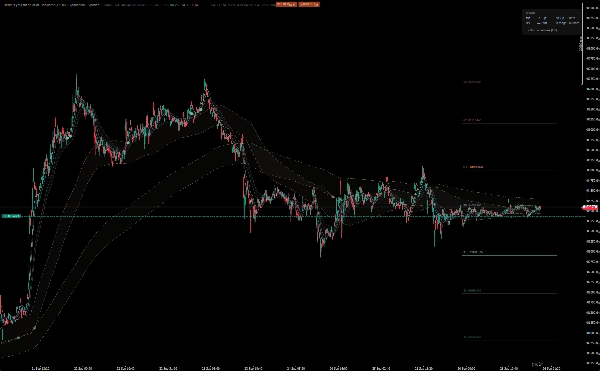
Trend is your friend - Indicator Most trend indicators give you a single line that price keeps crossing back and forth. This one draws two channels. A trend is confirmed only when they separate completely, and that simple rule removes a lot of false signals. HOW IT WORKS Fast band: a moving average of highs and lows over a short period. Slow band: the same over a longer period. The whole fast band above the slow band: UPTREND. The whole fast band below the slow band: DOWNTREND. The bands overlap: FLAT or transition. Stand aside or trade the range. A dot marks the exact moment a new trend starts, placed right where the lines cross. The highlighted edge of the fast band is the line the cBot's pullback entries react to. WHAT YOU SEE ON THE CHART Higher-timeframe bands on the same chart. Watch the H1 trend while trading M15, without switching charts. Four display options: - STEP_CLOSED shows exactly what an automated system can see. - SMOOTH_NO_REPAINT is the default: smooth and never redrawn. - STEP_LIVE and SPLINE_REPAINTS follow the forming higher-timeframe candle and are labelled as repainting. If you pick a timeframe that is not higher than the chart, the indicator can choose a suitable one for you (M15 or lower -> H1, up to H4 -> D1, D1 -> W1). Cross dots that know your filters. A new trend dot is bright when all your conditions agree: higher-timeframe trend, band distance, trading hours. It is dimmed and hollow when something blocks it. Optional dots also show where a trend ended and where the higher timeframe crossed. Signal markers for every cBot mode. Switch on MA, RSI, MACD, Stochastic, candle series or pivot markers. Diamonds appear on the closed candles where that condition was met, bright if it passed the filters and faded if it was filtered out. It is a quick visual way to judge a setting before you backtest it. Trend panel. A compact box showing the trend on both timeframes, the gap between the bands in pips and how many bars the trend has lasted. Below that is a filter line: "longs only", "shorts only", "both sides" or "no entries (reason)". It also shows your trading hours and the last signal. It adapts to light and dark chart themes and can sit in any corner. Daily pivot points. Classic pivot, support and resistance levels for 1 to 30 days, with a choice of core, standard or full set. The levels the cBot uses for PIVOT mode are highlighted. Optional extras. Coloured fill in the trend gap, an entry-zone cloud for the cBot's allowed distance, and candle colouring by position relative to the fast band. SETTINGS Current TF bands: fast and slow period and MA type (defaults 17 / 50 EMA, the same as the cBot). Other TF bands: on/off, timeframe, auto selection, display mode, periods and types. Trend visuals: edge highlight, gap fill, candle colouring. Cross dots: trend start/end dots, higher-timeframe dots, dot style and size, how many bars of history to mark. cBot mirror: only-MA-direction, entry distance and zone, min/max band distance, trading hours and timezone. cBot signals: signal mode, show filtered signals, RSI / MACD / Stochastic / candle series / pivot settings. Pivot points: on/off, days, level set, labels, highlight the cBot's levels. Trend panel: on/off, position, arrow style, details, filter row. Alerts and delivery: each alert type, which band, trigger, cooldown, popup, sound. ALERTS Popup and sound alerts for: - trend start or end - price returning to or leaving a band (checked at candle close or intrabar, with a cooldown) - a higher-timeframe trend change - the filter switching between longs only and shorts only - a new signal Nothing fires for past bars when you load the chart. BEST ON Any symbol and any intraday or higher timeframe (pivots need an intraday chart). The trend rule is measured on closed candles, and in the default modes nothing drawn on closed bars is redrawn later. USING IT WITH THE TREND IS YOUR FRIEND CBOT https://ctrader.com/products/3902 Use the same fast/slow periods and MA types as the cBot, and keep the higher-timeframe periods equal to them too. The cBot uses one set of periods for both timeframes. Set "Other TF" to the cBot's "Other TF MA direction", and choose STEP_CLOSED for the exact view the robot sees. Copy the distance, band-distance and trading-hour settings into the "cBot mirror" group. The indicator does not reproduce the cBot's ATR filter or its SLOW-channel option for MA mode. Treat the markers as a visual guide, not a trade log. NOTES Everything you do not need can be switched off, and the default look is deliberately calm: muted colours, light clouds. A visual tool for analysis only. It doesn't place trades and isn't investment advice.
Summary
The indicator marks trend changes with dots at crossover points and highlights the fast band edge used by the corresponding Trend is your friend cBot for pullback entries. It supports displaying higher-timeframe bands on the same chart, allowing traders to monitor multiple timeframes simultaneously with selectable display modes including non-repainting and repainting options.
Additional features include signal markers for various technical conditions (MA, RSI, MACD, Stochastic, candle series, pivots), a compact trend panel showing trend status and filters, daily pivot points with customizable levels, and configurable alerts for trend starts/ends and band interactions. Visual customization options include trend gap fills, entry-zone clouds, and candle coloring relative to the fast band.
The indicator is compatible with any symbol and intraday or higher timeframes, designed as an analysis tool without trade execution capabilities. It aligns with the Trend is your friend cBot settings for consistent trend interpretation.