
Description
Transformez le chaos des prix en canaux de tendance clairs grâce aux mathématiques précises de la régression.
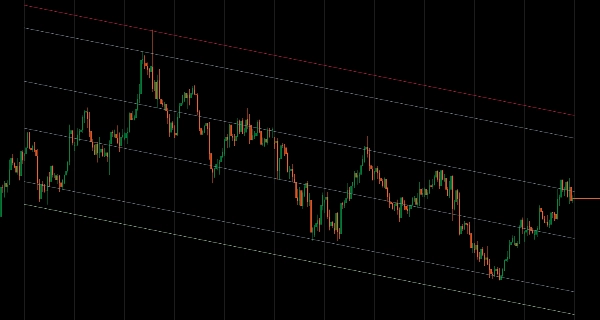
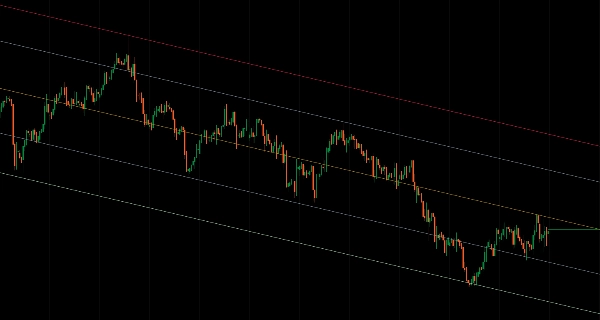
Regression Channel calcule une ligne de régression linéaire à travers vos données de prix sélectionnées et trace des limites supérieures/inférieures basées sur les écarts de prix - vous offrant une vue statistiquement fondée de la direction de la tendance et des zones potentielles de retournement.
Parfait pour
- Les traders structurels cherchant une définition objective de la tendance
- Les traders de réversion à la moyenne identifiant les extrêmes de surachat/survente
- Les traders de cassure repérant les violations de canal et les changements de momentum
- Analyse multi-échelle - tracez la régression mensuelle sur des graphiques journaliers pour le contexte
Caractéristiques clés
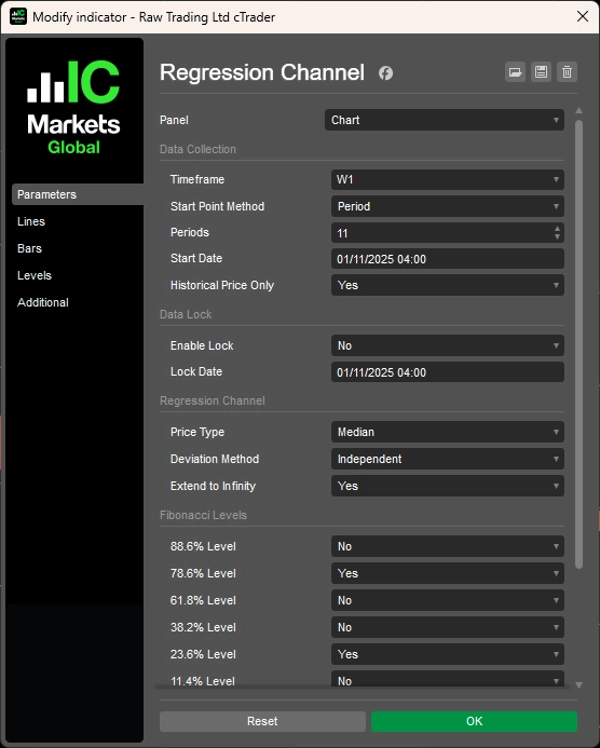
- Sélection flexible des données
-
- Mode Période : Analysez les N dernières barres (par exemple, les 12 dernières chandelles mensuelles)
- Mode DateHeure : Commencez à partir d'événements ou de dates spécifiques du marché
- Mécanisme de verrouillage : Figez l'analyse à un point historique pendant que le prix continue
- Multi-échelle : Tracez la régression depuis n'importe quelle échelle temporelle sur votre graphique actuel
- Méthodes d'écart intelligentes
-
- Moyenne : Niveaux équilibrés utilisant les écarts moyens (idéal pour les zones de trading)
- Indépendant : Canaux asymétriques qui s'adaptent à la volatilité directionnelle
- Maximum : Montre les limites extrêmes des prix pour une analyse complète de la plage
- Outils professionnels
-
- 6 niveaux de retracement Fibonacci (11,4 %, 23,6 %, 38,2 %, 61,8 %, 78,6 %, 88,6 %)
- 6 types de prix : Ouverture, Haut, Bas, Clôture, Médian, Typique
- Mode historique uniquement : Exclut les barres en formation pour un backtesting stable
- Option d'extension à l'infini pour les projections à long terme
- Personnalisation complète des couleurs
Pourquoi il se démarque
Contrairement aux outils de régression basiques, cet indicateur vous donne le contrôle. Verrouillez votre analyse pour étudier comment le prix s'est comporté après un événement spécifique. Passez entre des canaux symétriques et asymétriques. Combinez la structure d'une échelle temporelle supérieure avec l'exécution d'une échelle inférieure - le tout avec un code propre et efficace conçu pour la fiabilité.
Graphiques clairs. Structure nette. Décisions confiantes.


