present
Registe-se e receba 50 $ de desconto na sua primeira compra
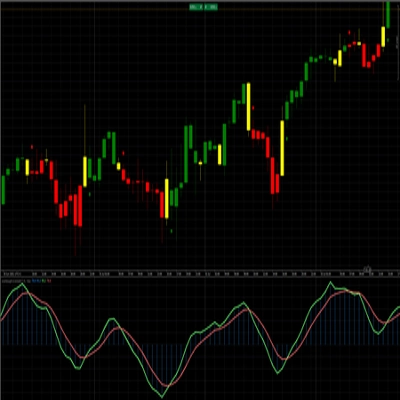
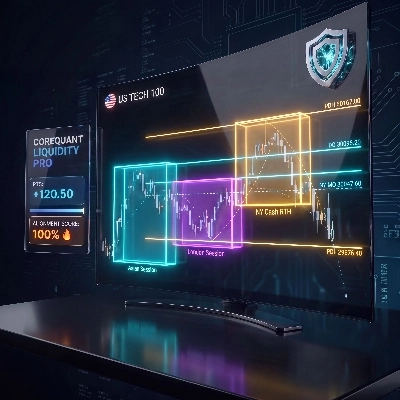
Trading product for Royal liquidity X Indicador Supertrend Liquidity Sweep, image 1
Royal liquidity X
Indicador
Versão 1.0, May 2026
Windows, Mac
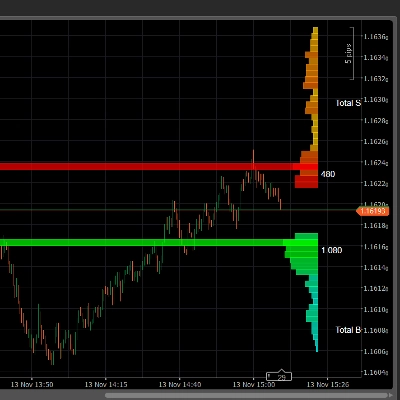
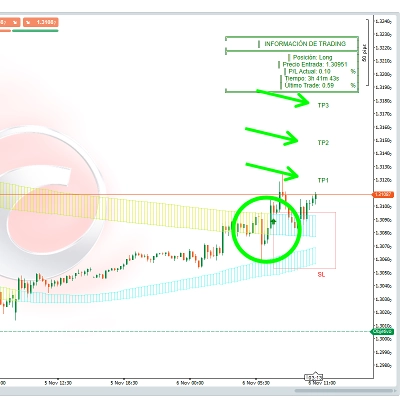
Trading product for Royal liquidity X Indicador Supertrend Liquidity Sweep, image 2
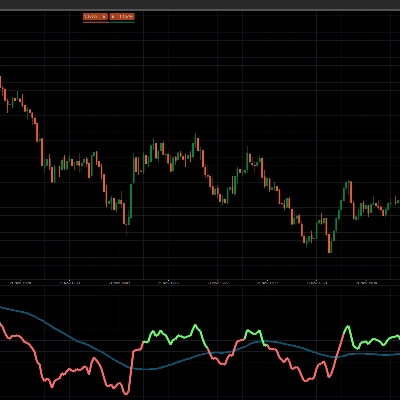
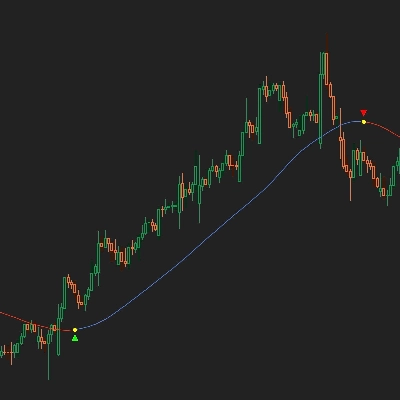
Trading product for Royal liquidity X Indicador Supertrend Liquidity Sweep, image 3
86
Vendas
1.18K
Instalações gratuitas

Descrição

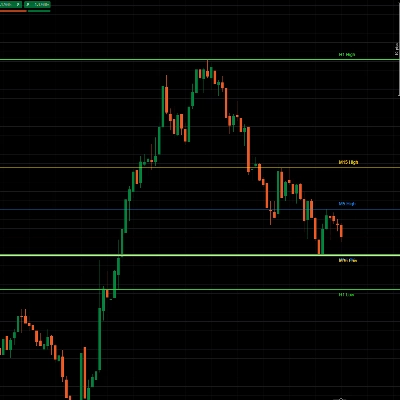
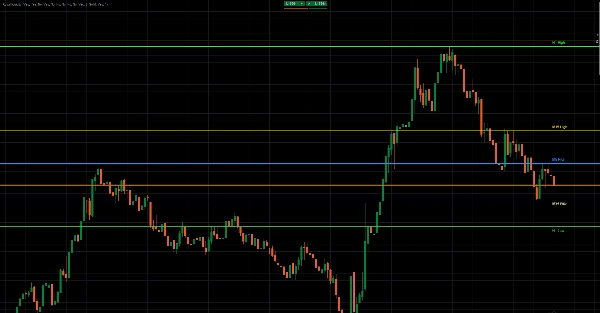
Royal Liquidity X is a clean and powerful multi-timeframe liquidity level indicator designed to display the previous high and previous low from multiple key timeframes directly on the chart.

The indicator helps traders quickly identify important liquidity zones where price may react, sweep liquidity, reject, break out, or continue with momentum. By plotting previous highs and lows from timeframes such as M5, M15, M30, H1, H2, H3, H4, H8, H12, and D1, Royal Liquidity gives traders a clear overview of the most relevant intraday and higher-timeframe liquidity levels.

These previous highs and lows are often watched by traders because they can act as potential stop-loss zones, breakout areas, reversal points, or price magnets. Royal Liquidity makes these levels visible automatically, without the need to manually draw them every session.

How It Works

Royal Liquidity reads the most recently closed candle from each selected timeframe. For every enabled timeframe, it takes the previous candle’s high and low and plots them as horizontal levels on the active chart.

For example:

M15 High = High of the last closed M15 candle
M15 Low = Low of the last closed M15 candle
H1 High = High of the last closed H1 candle
H1 Low = Low of the last closed H1 candle
D1 High = High of the last closed daily candle
D1 Low = Low of the last closed daily candle

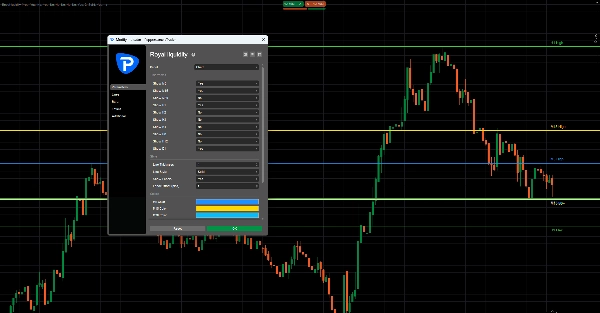
The indicator updates only on the latest chart bar, keeping the chart efficient and lightweight. Each timeframe can be turned on or off individually, and every level can have its own custom color. Traders can also adjust line thickness, line style, labels, and label offset.

What It Shows

Royal Liquidity can display:

Previous M5 High / Low
Previous M15 High / Low
Previous M30 High / Low
Previous H1 High / Low
Previous H2 High / Low
Previous H3 High / Low
Previous H4 High / Low
Previous H8 High / Low
Previous H12 High / Low
Previous D1 High / Low

Each level is drawn as a horizontal line, with optional labels such as M15 High, M15 Low, H1 High, H1 Low, and D1 High / Low.

Trading Use Cases

Royal Liquidity can help traders identify:

Liquidity sweeps
Price may move above a previous high or below a previous low to collect liquidity before reversing.

Breakout zones
A strong break above a previous high or below a previous low can signal continuation or momentum.

Reversal areas
Previous highs and lows can act as important reaction zones where price may reject.

Intraday targets
Higher-timeframe highs and lows can be used as potential target zones.

Market structure context
The indicator helps traders see where price is trading relative to important previous candle levels.

Short Marketplace-Style Version

Royal Liquidity is a multi-timeframe previous high and low indicator built to reveal key liquidity levels directly on your chart. It automatically plots the previous highs and lows from selected timeframes, including M5, M15, M30, H1, H4, H12, and D1.

Designed for liquidity-based traders, breakout traders, scalpers, and intraday traders, Royal Liquidity helps identify potential sweep zones, breakout areas, reversal levels, and profit targets with a clean visual layout.

Disclaimer

Royal Liquidity is a technical analysis tool and does not guarantee profitable trades. It should be used together with risk management, market structure analysis, and a complete trading plan.

Resumo

Perfil do indicador
Categoria do indicador
Tendência
Tipo de resultado
Sinais
Requisitos de dados
Dados de tick
Sinais suportados
Quebra
Cruzamento
Quebra de nível
Inversão

Conversa

Avaliações de clientes

0.0
Avaliações: 0
Avaliações de clientes
Ainda não há avaliações para este produto. Já o experimentou? Seja o primeiro a contar a outras pessoas!

Perguntas frequentes

Supertrend
Liquidity Sweep
Liquidity Grab
Os produtos disponíveis através da cTrader Store, incluindo bots de negociação, indicadores e plugins, são fornecidos por programadores terceiros e são disponibilizados apenas para fins informativos e de acesso técnico. A cTrader Store não é um corretor e não fornece aconselhamento em matéria de investimento, recomendações pessoais ou qualquer garantia de desempenho no futuro.

Mais deste autor

Indicador
AI
ATR
+27
SR Commander is a clean and intelligent support and resistance indicator for cTrader, built to help traders identify key
Indicador
AI
ATR
+20
Buy and Sell Signals
Indicador
AI
ATR
+27
WICK COMMANDER — Know Exactly When the Market Commits
Indicador
AI
ATR
+27
Overbought Oversold Indicator
Indicador
AI
ATR
+20
Know Sure Thing (KST) momentum engine
Indicador
AI
SMC
+5
Coloring trendline/ Colored Trendline / Color Trendline
Indicador
AI
ATR
+27
VWAP Sniper Elite -- Institutional Trend Engine
Indicador
AI
SMC
+13
Dynamic Liquidity Depth exposes hidden volume
Indicador
AI
ATR
+26
Entry Momentum MACD Power Guide
Indicador
AI
ATR
+27
The Professional “All-in-One” Trading Suite (buy and sell indicator)
Indicador
AI
ATR
+26
SR Commander — Multi Timeframe Edition. See where the big money draws the line. Trade on your timeframe. Think on theirs
Logótipo de "crossover 1"
Bem avaliado
4.2
(5)
$19
/
$29
Indicador
AI
Grid
+10
Crossover Buy and Sell Alerts and signals

Também poderá gostar de

Indicador
ADX
ATR
+5
Configure, simulate, and analyze trading strategies with custom filters, multi-target exits, and detailed performance me
Indicador
Doji
Volume
+5
Instantly spot high-liquidity institutional moves with clean, non-obtrusive triangle alerts on cTrader charts.
Indicador
MACD
Signal
Enhance your trading strategy with our customizable TradingViewMACD indicator. Optimize and elevate your market analysis
Indicador
Forex
BTCUSD
+11
Visualize trends with Standard Deviation Channel! Display median, and add customizable upper/lower deviation channels.
Indicador
AI
ATR
+27
An advanced VWAP with multi-VWAP (Daily/Weekly/Monthly/Anchored), click-to-anchor, configurable alerts, a stats panel,
Indicador
RSI
VegaXLR's cTrader StochRSI identifies overbought/oversold RSI levels for precise trade entries.
Indicador
Prop
Forex
+4
HMA MTF 2.0 (Multi-Timeframe )
Indicador
Breakout
FlexSR auto‑detects pivot highs/lows to plot dynamic support & resistance lines Features customizable styling and option
Indicador
ADX
ATR
+2
GOLD SENTINEL v1.0 - A CANDLE-COLORING INDICATOR FOR GOLD.
Indicador
Shows daily and sessions highs / lows and session boxes, everything configurable
Indicador
Forex
BTCUSD
+5
This indicator displays the OrderBlocks of the current and higher timeframe, made by ICT's student.
Indicador
Prop
Forex
+11
🧭 See when your market tends to move—by Month, Day-of-Week, or Hour-of-Day🧭
Indicador
Pin Bar
Inducement
+5
Institutional Nasdaq Session Liquidity Map with Live Point HUD, Sweep Alerts & Interactive Playbook.
Indicador
Forex
BTCUSD
+10
🎯Smart Signals : Auto Buy/Sell alerts with dynamic TP/SL algorithm. 💡
Indicador
Forex
BTCUSD
+10
6-stage IIR filter trend indicator with colored line segments, reversal signals, alerts, and entry arrows.
Indicador
Signal
Breakout
+1
Bolliger Bands + Hamster-Coder™ Timeframe Decoupling
Indicador
Boost your trading with Candlestick Patterns for cTrader – auto-detect key signals for smarter, faster decisions!
Indicador
CandleColourFlow MultiFx - optimized to work on Fx Majors, Fx MInors, Fx Crosses

Preço

86
Vendas
1.18K
Instalações gratuitas