
Opis
MACD Sniper Elite Multi-Timeframe to precyzyjnie zaprojektowana wieloczasowa mapa cieplna MACD, stworzona dla traderów, którzy chcą szybszego dopasowania trendu, czystszej potwierdzenia momentum i precyzyjniejszego timingu transakcji.
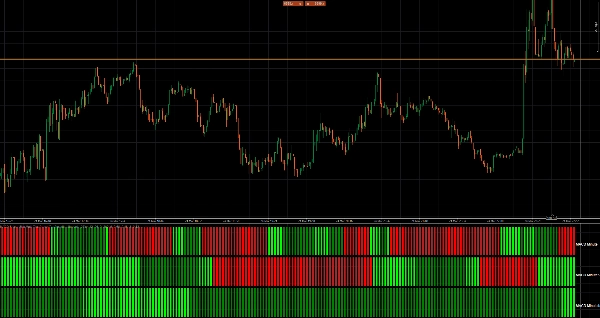
Zamiast obserwować wiele wykresów i ręcznie porównywać warunki MACD w różnych ramach czasowych, ten wskaźnik kompresuje te informacje do jednego potężnego podokna z czytelnym układem wizualnym w 3 rzędach. Każdy rząd reprezentuje wybieralną ramę czasową i natychmiast pokazuje, czy momentum MACD się wzmacnia, słabnie, jest bycze czy niedźwiedzie.
Efekt jest prosty: możesz szybciej zauważyć dopasowanie, wcześniej odfiltrować słabe sygnały i skupić się na wejściach o wysokim prawdopodobieństwie z większą pewnością.
Dlaczego traderzy to kochają
Wieloczasowa przejrzystość na pierwszy rzut oka
Zobacz warunki MACD z 3 różnych ram czasowych w jednym kompaktowym panelu.
Stworzony do szybkiego podejmowania decyzji
Koniec z przełączaniem się między wykresami, aby potwierdzić kierunek momentum.
Wizualizacja siły trendu
Silnik kolorów robi więcej niż pokazuje kierunek. Podkreśla także, czy momentum przyspiesza, czy słabnie.
Wejścia w stylu snajpera
Idealne dla traderów, którzy chcą dopasować wejścia z niższych ram czasowych do momentum z wyższych ram czasowych.
Czysty i efektywny design
Wyświetlacz jest minimalistyczny, czytelny i zoptymalizowany do szybkiej analizy wykresów.
Jak to działa
Wskaźnik używa 3-rzędowej wieloczasowej mapy cieplnej.
- Rząd 1 = wybieralna rama czasowa MACD
- Rząd 2 = wybieralna rama czasowa MACD
- Rząd 3 = wybieralna rama czasowa MACD
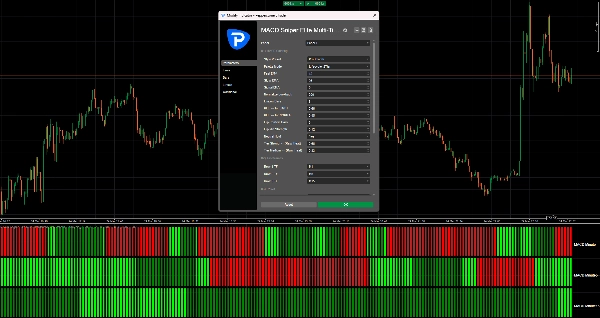
Każdy rząd oblicza własny MACD używając:
- Szybkiej EMA
- Wolnej EMA
- EMA sygnałowej
Domyślnie wskaźnik używa klasycznych ustawień MACD:
- Szybka EMA = 12
- Wolna EMA = 26
- EMA sygnałowa = 9
Logika kolorów
Każdy rząd jest kodowany kolorami, aby pokazać zarówno:
- kierunek
- jakość momentum
Zielone odcienie wskazują bycze ciśnienie MACD.
Czerwone odcienie wskazują niedźwiedzie ciśnienie MACD.
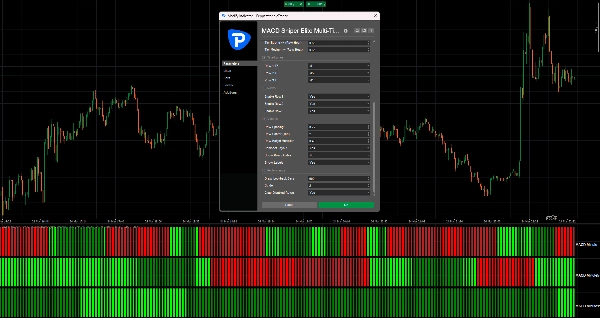
W zależności od wybranego trybu palety, kolory mogą pokazywać:
- silną aktywację trendu
- utrzymujące się momentum trendu
- słabnące warunki trendu
- surową intensywność momentum
Tryb cyklu życia 2-poziomowego
To jeden z najpotężniejszych trybów wizualnych w wskaźniku.
W tym trybie:
- Jasnozielony / Jasnoczerwony = świeże lub silne momentum trendu
- Normalny zielony / Normalny czerwony = momentum jest nadal ważne, ale zaczyna słabnąć
To znacznie ułatwia identyfikację, czy ruch nadal się rozwija, czy już traci siłę.
Tryby 3-poziomowe i surowej mapy cieplnej
Dla traderów, którzy chcą jeszcze więcej szczegółów wizualnych, wskaźnik zawiera również:
- 3-poziomowy cykl życia
- 3-poziomowa surowa mapa cieplna
Te tryby dodają więcej gradacji do siły momentum i rozwoju trendu.
Najlepsze zastosowanie
MACD Sniper Elite Multi-Timeframe jest idealny dla traderów, którzy chcą:
- dopasować wejścia z niższych ram czasowych do biasu z wyższych ram czasowych
- unikać handlu przeciwko momentum
- potwierdzić kontynuację trendu
- wykrywać słabnące trendy zanim odwrócenia staną się oczywiste
- upraszczać analizę wieloczasową
Sprawdza się szczególnie dobrze w:
- skalpowaniu
- handlu intraday
- handlu dziennym
- handlu momentum
- strategiach podążania za trendem
Przykładowy workflow
Typowy sposób użycia wskaźnika to:
- Rząd 1 = momentum ramy czasowej wejścia
- Rząd 2 = rama czasowa potwierdzenia
- Rząd 3 = bias wyższej ramy czasowej
Na przykład:
- Rząd 1 = M1
- Rząd 2 = M5
- Rząd 3 = M15
Gdy wszystkie rzędy stają się bycze, momentum jest wyrównane.
Gdy dolny rząd słabnie, podczas gdy wyższe rzędy pozostają silne, może to sygnalizować cofnięcie lub ruch w późnej fazie.
Gdy wszystkie rzędy zmieniają się razem, często wskazuje to na silniejszą fazę kierunkową.
Kluczowe zalety
- 3 w pełni wybieralne ramy czasowe MACD
- wbudowane klasyczne ustawienia MACD
- premium silnik kolorów w stylu mapy cieplnej
- wizualizacja cyklu życia trendu
- kompaktowy design podokna
- łatwe do czytania etykiety
- optymalizacja pod szybszy workflow
- idealny dla traderów precyzyjnych wejść
Podsumowanie
Opinie klientów
5 | 50 % | |
4 | 50 % | |
3 | 0 % | |
2 | 0 % | |
1 | 0 % |


![Logo „[Hamster-Coder] Pivot Points MTF”](https://cdn.ctrader.com/image/webp/4c143e5a-309c-40e3-a578-f04d1e133ffa_31159)


