RSI Indicator
อินดิเคเตอร์
เวอร์ชัน 1.0, May 2026
Windows, Mac
Trading product for RSI Indicator อินดิเคเตอร์ SMA RSI, image 2
Trading product for RSI Indicator อินดิเคเตอร์ SMA RSI, image 3
89
การขาย
149
ติดตั้งฟรี

คำอธิบาย

โชว์เคส:


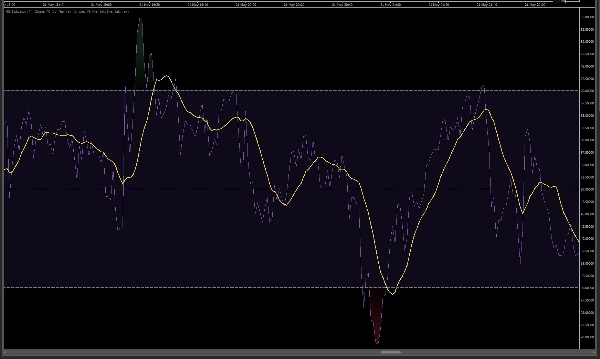
ตัวชี้วัด RSI - ตัวชี้วัดนี้เป็นการใช้งานขั้นสูงแต่เรียบง่ายของออสซิลเลเตอร์ Relative Strength Index (RSI) แบบคลาสสิกสำหรับแพลตฟอร์ม cTrader ได้รับการพัฒนาอย่างเคร่งครัดตามตัวชี้วัดต้นฉบับจาก TradingView (อ้างอิงตามข้อกำหนดอย่างเป็นทางการของพวกเขา)

ด้วยการใช้โมเดลการปรับค่าเฉลี่ยเคลื่อนที่แบบ RMA (Running Moving Average) ตัวชี้วัดนี้จึงทำงานและแสดงผลเหมือนกับตัวชี้วัด TradingView อย่างแม่นยำ เรายังได้มั่นใจว่าประสบการณ์การมองเห็นตรงกันอย่างสมบูรณ์แบบ

คุณสมบัติและฟังก์ชันหลัก:

  • ความเข้ากันได้ 100% กับ TradingView: อัลกอริทึมใช้ตรรกะการคำนวณเดียวกันกับตัวชี้วัด TV ต้นฉบับ (อ้างอิงตามสูตร RMA)
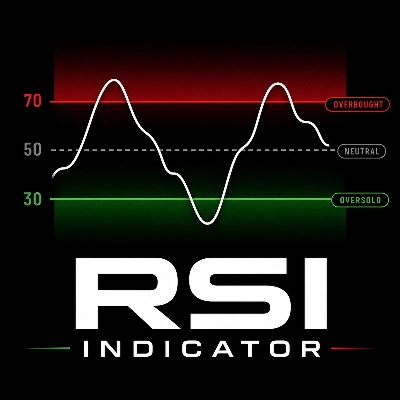
  • การออกแบบภาพที่น่าทึ่ง (ไล่ระดับสีแบบไดนามิก): มีการใช้ระบบการไล่ระดับสี 30 ระดับที่เป็นนวัตกรรมใหม่ ยิ่ง RSI เคลื่อนเข้าสู่โซนซื้อมากเกินไป (เหนือ 70) พื้นหลังสีแดงจะยิ่งเข้มขึ้น ยิ่งลดลงสู่โซนขายมากเกินไป (ต่ำกว่า 30) สีเขียวจะยิ่งลึกขึ้น ช่วงกลางยังคงรักษาโทนสีม่วงแบบคลาสสิก
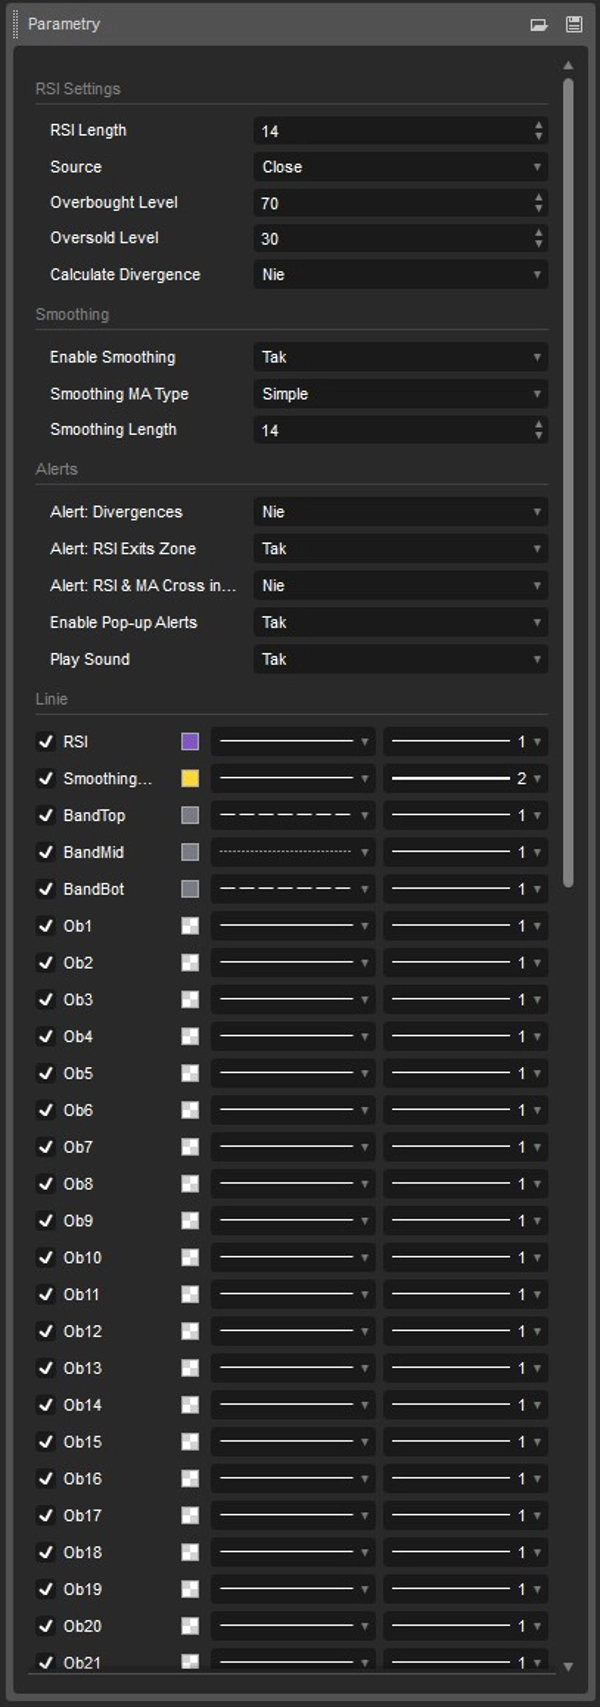
  • ค่าเฉลี่ยเคลื่อนที่ในตัว (MA): เช่นเดียวกับเวอร์ชันล่าสุดของ TV คุณสามารถเปิดใช้งานเส้นค่าเฉลี่ยเคลื่อนที่ (เช่น SMA) ที่ช่วยปรับเส้น RSI ให้เรียบขึ้นและช่วยระบุแนวโน้มหรือเทรนด์ภายในออสซิลเลเตอร์เอง
  • การตรวจจับความแตกต่างโดยอัตโนมัติ: ตัวชี้วัดสามารถสแกนแผนภูมิหา divergence แบบปกติได้โดยอัตโนมัติ เมื่อพบความไม่ตรงกันระหว่างราคาและความแข็งแกร่งของแนวโน้ม RSI จะวาดเส้นและเครื่องหมาย (Bullish: สีเขียว, Bearish: สีแดง) โดยตรงในหน้าต่างตัวชี้วัด
  • ระบบแจ้งเตือนที่ทรงพลัง (ป๊อปอัพ & เสียง): ติดตามข่าวสารได้ตลอดเวลา ตัวชี้วัดจะแจ้งเตือนคุณเมื่อ:
    • RSI ออกจากโซนซื้อมากเกินไป/ขายมากเกินไป (สร้างสัญญาณซื้อ/ขายแบบคลาสสิก),
    • เส้น RSI ตัดกับเส้น MA ลึกภายในโซนเหล่านี้,
    • ตรวจพบ divergence ใหม่.

ตัวชี้วัดนี้เหมาะกับใคร?

หากคุณคุ้นเคยกับการวิเคราะห์ RSI บน TradingView กำลังมองหาสัญญาณที่ตรงกันอย่างสมบูรณ์ใน cTrader และให้ความสำคัญกับการออกแบบที่สะอาดตาและน่าดึงดูดทางสายตา (โดยไม่ต้องปรับสีด้วยตนเอง) ตัวชี้วัดนี้คือทางเลือกที่เหมาะสม

ใช้งานง่าย แม่นยำในการทำงาน และซื่อสัตย์ต่อต้นฉบับ!

cGuru

สรุป

สรุปโดย AI
The RSI Indicator is a cTrader implementation of the classic Relative Strength Index oscillator, designed to replicate TradingView’s original indicator using the Running Moving Average (RMA) smoothing method. It provides 100% calculation compatibility with TradingView, ensuring identical signal behavior and visual presentation. Key features include a dynamic 30-level gradient color scheme that visually distinguishes overbought (red) and oversold (green) zones, with a neutral purple mid-range. The indicator supports an optional moving average line (e.g., SMA) to smooth the RSI curve and highlight trends within the oscillator. It also offers automatic detection of regular divergences between price and RSI trends, marking bullish and bearish divergences directly on the chart. A built-in alert system notifies users via pop-up and sound when the RSI exits overbought/oversold zones, crosses the moving average within these zones, or when new divergences are detected. This indicator is suitable for traders familiar with TradingView’s RSI who seek an accurate, visually clear, and feature-rich RSI tool within the cTrader platform.
โปรไฟล์อินดิเคเตอร์
หมวดหมู่อินดิเคเตอร์
แนวรับและแนวต้าน
ประเภทเอาต์พุต
การแสดงเป็นภาพ
ข้อกำหนดด้านข้อมูล
ข้อมูล Tick
สัญญาณที่รองรับ
Reversal
Divergence

รีวิวจากลูกค้า

0.0
รีวิว: 0
รีวิวจากลูกค้า
ยังไม่มีรีวิวสำหรับผลิตภัณฑ์นี้ หากเคยลองแล้ว ขอเชิญมาเป็นคนแรกที่บอกคนอื่น!

การสนทนา

คำถามที่พบบ่อย

SMA
RSI
Moving Average
ผลิตภัณฑ์ที่มีให้บริการผ่าน cTrader Store รวมถึงบอทการเทรด อินดิเคเตอร์ และปลั๊กอิน มีให้บริการโดยนักพัฒนาบุคคลที่สามและมีไว้เพื่อวัตถุประสงค์ในการเข้าถึงข้อมูลและทางเทคนิคเท่านั้น cTrader Store ไม่ใช่โบรกเกอร์และไม่ได้ให้คำแนะนำการลงทุน คำแนะนำส่วนบุคคล หรือการรับประกันผลการดำเนินงานในอนาคต

เพิ่มเติมจากผู้เขียนคนนี้

อินดิเคเตอร์
AI
ATR
+27
Trend Is Your Friend cBot - INDICATOR - Professional Grid, Pyramid, Swing & Scalp Trading Indicator
"Supertrend Indicator v1.1" โลโก้
ยอดนิยม
4.3
(3)
$19
/
$30
อินดิเคเตอร์
AI
ATR
+27
Supertrend Indicator
"Nadaraya-Watson Indicator" โลโก้
ยอดนิยม
5.0
(2)
$19
/
$30
อินดิเคเตอร์
AI
ATR
+27
Nadaraya-Watson Envelope Indicator
"Market Cipher B" โลโก้
ยอดนิยม
4.6
(3)
$30
/
$50
อินดิเคเตอร์
AI
ATR
+27
Market Cipher B
"Supertrend Indicator" โลโก้
ยอดนิยม
4.6
(3)
$19
/
$30
อินดิเคเตอร์
AI
ATR
+27
Supertrend Indicator
อินดิเคเตอร์
AI
ATR
+26
MacD Custom Indicator-Multiple Time Frame
"RSI Simple Grid cBot" โลโก้
ยอดนิยม
5.0
(2)
$39
cBot
AI
ATR
+27
RSI Simple Grid cBot - grid trading strategy with RSI (Relative Strength Index) signals
26.8%
ROI
4.41
อัตราส่วน กำไรต่อขาดทุน
"Market Cipher A" โลโก้
ยอดนิยม
4.6
(3)
$30
/
$50
อินดิเคเตอร์
AI
ATR
+19
Market Cipher A
cBot
AI
ATR
+27
SmartHedge cBot - Your Trading Companion
1.26
อัตราส่วน กำไรต่อขาดทุน
cBot
ATR
RSI
+5
Trend is your friend cBot - Professional Grid, Pyramid, Swing & Scalp Trading System
28%
ROI
5.27
อัตราส่วน กำไรต่อขาดทุน
อินดิเคเตอร์
EMA
SMA
+3
MACD indicator modeled after TradingView, featuring a 4-color momentum histogram, sound/pop-up crossover alerts.

นอกจากนี้คุณยังอาจชอบ

อินดิเคเตอร์
Key Levels
Liquidity Grab
+3
Visual market context dashboard showing bias states, CE positioning, session status and sweep context.
อินดิเคเตอร์
Prop
Forex
+12
A clean, real-time risk HUD designed to prevent prop firm account failure and protect your challenge account.
อินดิเคเตอร์
MACD
Key Levels
+2
Trend indicator with multi-timeframe filters, generating signals only on fully completed bricks & candles. No Repaint.
อินดิเคเตอร์
SMC
Prop
+14
BoS ChoCH Pro,Strict Mode,False Breakout Filter,Average hit rate: 72-78%
อินดิเคเตอร์
RSI
Breakout
+1
🚀 TrendHeikinMultiMA: Advanced trend detection using Heikin-Ashi smoothing & MAs! Eliminates noise, confirms real trend
"MACD Pro Trader" โลโก้
ยอดนิยม
4.5
(4)
$19
/
$20
อินดิเคเตอร์
MACD
Forex
+5
🚀 MACD Pro Trader – Advanced MACD with buy/sell signals, custom MAs & color-coded histograms for smarter trading! 📈🔥
อินดิเคเตอร์
Drawdown Monitor
Proprietary trading desk risk monitoring dashboard!
อินดิเคเตอร์
Indices
Multi-Timeframe ADX Trend Dots & Arrows
อินดิเคเตอร์
MSS
Key Levels
+2
Maps equal highs, equal lows and active liquidity pools directly on your cTrader chart.
"Supertrend Indicator" โลโก้
ยอดนิยม
4.6
(3)
$19
/
$30
อินดิเคเตอร์
AI
ATR
+27
Supertrend Indicator
"Phoenix Zones" โลโก้
ยอดนิยม
5.0
(2)
$19
/
$38
อินดิเคเตอร์
AI
Prop
+9
Phoenix Zones - Detector de Reversiones Críticas
อินดิเคเตอร์
Prop
Forex
+7
The Parabolic SAR, or "Stop and Reverse," is a dynamic technical analysis tool.
"Series - FXMaster" โลโก้
ยอดนิยม
4.6
(3)
$19
อินดิเคเตอร์
Forex
Crypto
+3
Consecutive Series Moves — Reveal the True Pulse of Price Action
อินดิเคเตอร์
ATR
RSI
+9
🚀 MACARX Indicator - The Multi-Indicator Trend Fusion 🚀
"Cumulative Volume Delta" โลโก้
ยอดนิยม
4.0
(1)
$19
/
$35
อินดิเคเตอร์
SMC
Prop
+17
Unlock the true intent of market participants with the Classic Proportional Cumulative Volume Delta CVD!
อินดิเคเตอร์
Volume
Key Levels
+1
Order book indicator .Don't trade against the flow. Trade with the truth!
"Supertrend" โลโก้
ยอดนิยม
4.3
(3)
$19
อินดิเคเตอร์
ATR
RSI
+6
💹 Define a price channel 📈 and determine trend direction (bullish 🟢 or bearish 🔴).
"UT Bot Alerts Nova" โลโก้
ยอดนิยม
5.0
(3)
$19
อินดิเคเตอร์
ATR
Forex
+6
UT Bot Alerts Nova: Advanced trend-following indicator using ATR for signals. Precise entries/exits.

ราคา

89
การขาย
149
ติดตั้งฟรี