คำอธิบาย
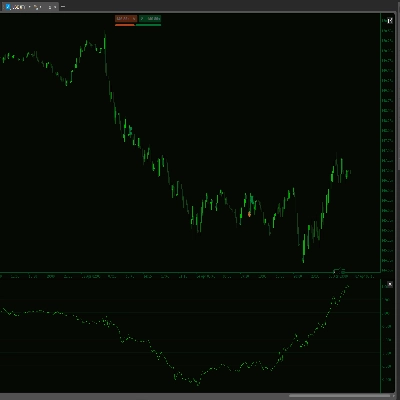
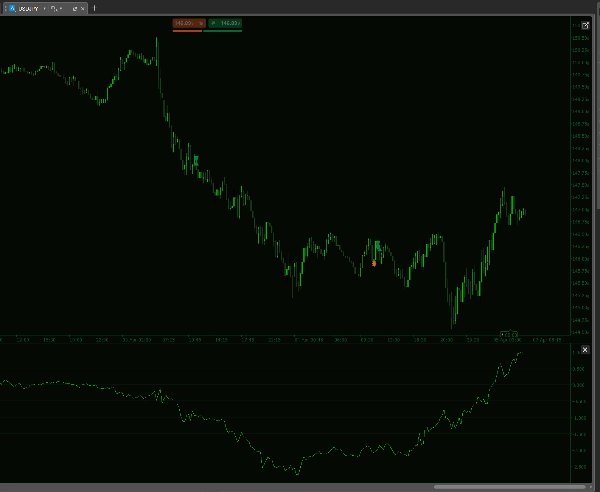
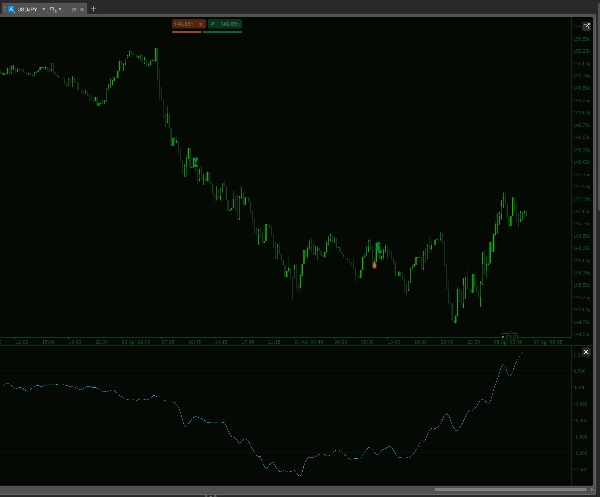
ยกระดับกลยุทธ์การเทรดของคุณด้วย Historical DXY HMA Indicator—เครื่องมือ cTrader ที่ล้ำสมัย ออกแบบมาเพื่อความแม่นยำและประสิทธิภาพ ตัวชี้วัดขั้นสูงนี้คำนวณดัชนีดอลลาร์สหรัฐแบบกำหนดเองโดยรวมการเปลี่ยนแปลงเปอร์เซ็นต์ถ่วงน้ำหนักของคู่สกุลเงินหลักหกคู่ มอบมาตรวัดตลาดที่มีความเคลื่อนไหวและเชื่อถือได้แก่คุณ
คุณสมบัติหลัก:
- การคำนวณ DXY แบบกำหนดเอง: รวมคู่ USD หลักหกคู่ (EURUSD, USDJPY, GBPUSD, USDCAD, USDCHF, USDSEK) พร้อมน้ำหนักที่ปรับได้เพื่อดัชนีที่ปรับแต่งอย่างละเอียด
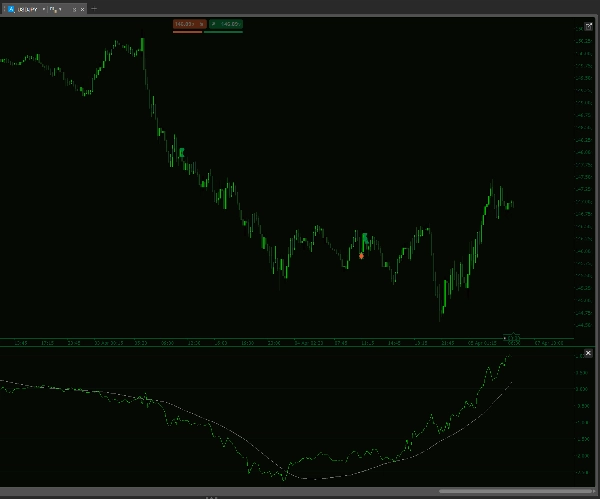
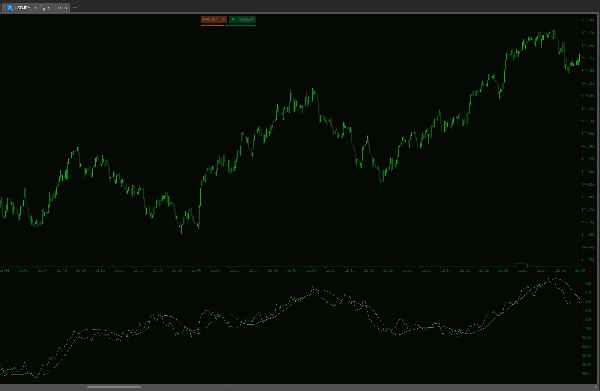
- ค่าเฉลี่ยเคลื่อนที่ Hull คู่: ใช้ Hull MA ทั้งระยะสั้นและระยะยาวเพื่อให้ภาพที่ชัดเจนของแนวโน้มและโมเมนตัมตลาด
- การปรับความชันให้เรียบ: เพิ่มประสิทธิภาพการตรวจจับแนวโน้มด้วย HMA ความชันที่เรียบเนียน ช่วยให้คุณได้เปรียบในการระบุการกลับตัวของตลาด
- การจัดการข้อมูลที่แข็งแกร่ง: ซิงค์กับแพลตฟอร์ม cTrader ของคุณอย่างราบรื่น เพื่อการวิเคราะห์เรียลไทม์ที่แม่นยำแม้เมื่อใช้แหล่งข้อมูลที่หลากหลาย
- พารามิเตอร์ที่ปรับแต่งได้: ปรับแต่งจำนวนการย้อนกลับและช่วงค่าเฉลี่ยเคลื่อนที่ให้เหมาะสมกับสไตล์การเทรดและสภาพตลาดของคุณอย่างสมบูรณ์แบบ
ออกแบบมาเพื่อเทรดเดอร์ยุคใหม่ Historical DXY HMA Indicator ช่วยให้ข้อมูลตลาดที่ซับซ้อนกลายเป็นข้อมูลเชิงลึกที่นำไปใช้ได้จริง ช่วยให้คุณตัดสินใจเทรดได้อย่างชาญฉลาดและมั่นใจยิ่งขึ้น สัมผัสประสบการณ์การวิเคราะห์ตลาดในระดับถัดไป!
--------------------------
โปรดตรวจสอบตัวชี้วัดอื่นๆ ของฉันได้เลย!
https://ctrader.com/products/1181
https://ctrader.com/products/1182
https://ctrader.com/products/1180
https://ctrader.com/products/1015
https://ctrader.com/products/555
https://ctrader.com/products/553
https://ctrader.com/products/554
https://ctrader.com/products/552
https://ctrader.com/products/557
https://ctrader.com/products/845
https://ctrader.com/products/848
https://ctrader.com/products/847
https://ctrader.com/products/846
https://ctrader.com/products/551
https://ctrader.com/products/574
https://ctrader.com/products/573
https://ctrader.com/products/556
https://ctrader.com/products/558
https://ctrader.com/products/559
https://ctrader.com/products/560