
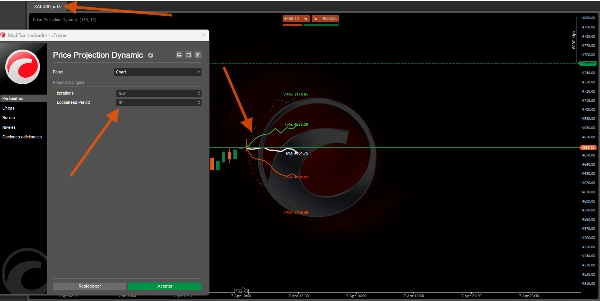
Açıklama
Fiyat Projeksiyonu Dinamik 📈🔮
https://chartshots.spotware.com/c/69d5304ea1cc1
Nedir?
https://chartshots.spotware.com/c/69d52fb4b01cd
Fiyat Projeksiyonu Dinamik, Monte Carlo simülasyonu kullanarak istatistiksel olarak olası gelecekteki fiyat yollarını projekte eden ve yönsel eğilimi Bayes olasılık sınıflandırıcısı ile değerlendiren bir üst gösterge göstergesidir. Bir soruya cevap verir: bu varlık nasıl hareket ettiyse, istatistiksel olarak bir sonraki adım neresi olabilir? 📊
https://chartshots.spotware.com/c/69d53010d38ce
Nasıl Çalışır ⚙️
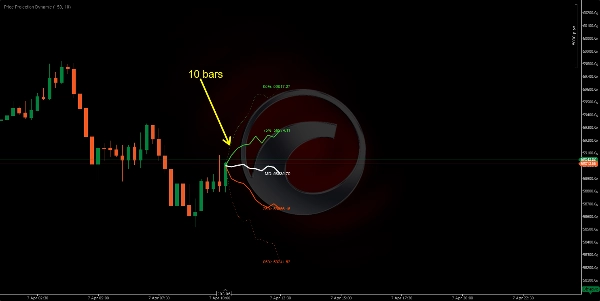
Motor 1 — Monte Carlo Projeksiyonu 🎲
Gösterge, yakın fiyat geçmişini analiz eder ve logaritmik getirileri çıkarır. Ortalama getiriyi ve standart sapmasını hesaplar — varlığın hem sürüklenmesini (eğilim) hem de volatilitesini (düzensiz hareket) yakalar 🌪️.
Geleceğe yönelik 200 simüle edilmiş fiyat yolu (500'e kadar) çalıştırır. Her simülasyon gerçek yakın hareketlere dayanan bir "rastgele yürüyüş"tür. Bunlardan, gösterge 5 persentil bandı çıkarır:
Bant
Anlamı
%95
İyimser uç — simülasyonların sadece %5'i daha yükseğe çıktı 🚀
%75
Üst olası aralık — fiyat simülasyonların %25'inde bunun üzerinde kapandı 📈
%50 (MD)
Medyan projeksiyon — tüm sonuçların istatistiksel merkezi 🎯
%25
Alt olası aralık — fiyat simülasyonların %25'inde bunun altında kapandı 📉
%05
Kötümser uç — simülasyonların sadece %5'i daha düşük seviyeye indi 📉🛑
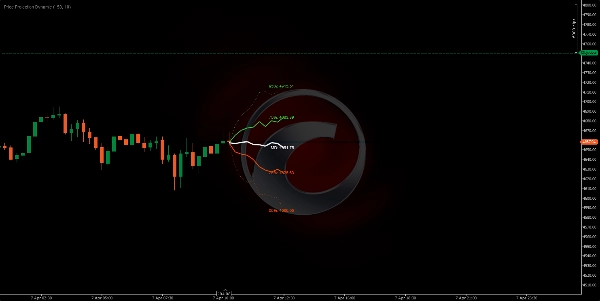
Profesyonel İpucu: Fan ne kadar geniş açılırsa, mevcut volatilite o kadar yüksektir 📢. Sıkı bir fan, varlığın tahmin edilebilir hareket ettiğini gösterir 🧵.
Motor 2 — Bayes Sınıflandırıcısı 🧠
Projeksiyondan bağımsız olarak, bu motor piyasayı boğa veya ayı olarak sınıflandırır:
- Bir pencere boyunca geriye bakar (varsayılan 500 bar) 🔍.
- Boğa ve ayı barları için göreceli hacim ve momentumu ölçer.
- Mevcut barın hangi profile daha iyi uyduğunu Gauss olasılığı ile hesaplar ⚖️.
Sonuç bir kazanma olasılığı yüzdesidir:
Olasılık
Yorum
> %70
Yüksek boğa güveni ✅🟢
%50–70
Orta / belirsiz ⚖️🟡
< %30
Yüksek ayı güveni ✅🔴
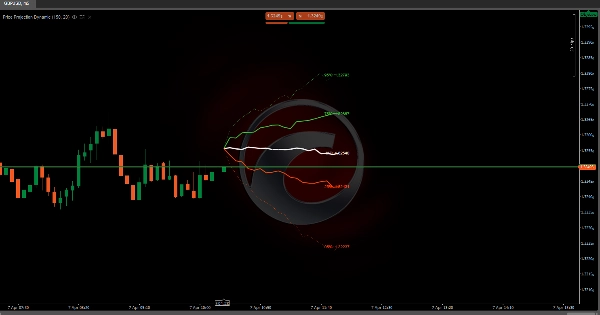
Görsel Öğeler 🎨
- Yeşil çizgiler (%75, %95): Üst projeksiyon bantları — boğa aralığı 🍏
- Beyaz çizgi (MD): Medyan projeksiyon fiyatı — en olası yol 🏁
- Turuncu çizgiler (%25, %05): Alt projeksiyon bantları — ayı aralığı 🍊
- Noktalı dış çizgiler: %95 ve %05 uçları (düşük olasılıklı sınırlar) ⚠️
- Düz iç çizgiler: %75, %50, %25 (yüksek olasılık bölgesi) ✅
- Fiyat etiketleri: Her persentil için kesin projeksiyon fiyatı 🏷️
- Bilgi paneli (sağ üst): Bayes kazanma olasılığı, medyan hedef, göreceli hacim, sinyal yönü 🖥️
Nasıl Kullanılır 📖
- Fan şeklini okuyun 📢 — Hızla genişliyorsa, volatilite yüksektir ve projeksiyonlar daha az kesindir.
- Medyan (MD) çizgisini kullanın 🎯 en istatistiksel olarak olası gelecekteki fiyat hedefi olarak.
- %75/%25 bantlarını kullanın 📏 işlemler için gerçekçi üst/alt hedefler olarak.
- %95/%05 bantlarını kullanın 🛑 aşırı sınırlar olarak — stop loss yerleştirmede faydalı.
- Bayes panelini kontrol edin 🧠 — %70'in üzerinde veya %30'un altında bir olasılık yönsel kararlılık katar.
- Her iki motoru birleştirin 🤝 — Medyan çizgi yukarı eğimli VE Bayes olasılığı %70'ten büyükse, kurulum istatistiksel olarak güçlüdür.
Ana Parametreler ⚙️
Parametre
Kontrol Ettiği Şey
Daha Yüksek Değer
Daha Düşük Değer
İterasyonlar
Simüle edilen yol sayısı
Daha düzgün bantlar 🌊
Daha hızlı hesaplama ⚡
İleriye Bakış
Gelecek projeksiyon mesafesi
Daha uzun ufuk 🔭
Daha kısa, daha güvenilir 🔍
Örnek Derinliği
Analiz edilecek yakın barlar
Uzun vadeli davranış 🐢
Sadece yakın davranış 🐇
Sınıflandırıcı Penceresi
Bayes geçmişi
Daha stabil olasılık ⚖️
Daha reaktif ⚡
Gösterge Profili 📋
- Gösterge kategorisi: İstatistik 📊
- Çıktı türü: Görselleştirme & Sinyaller 🖼️
- Veri gereksinimleri: Sadece barlar 📶
Feragatname ⚠️
Bu gösterge istatistiksel olasılıkları projekte eder, tahminlerde bulunmaz 🔮. Monte Carlo simülasyonları geleceğin yakın geçmişe benzeyeceğini varsayar — bu, kara kuğu olayları 🦢 veya haber kaynaklı boşluklarda bozulur. Kendi risk yönetiminizle birlikte olasılıksal bir çerçeve olarak kullanın 🛡️.
Özet
Separately, the Bayesian classifier evaluates market sentiment by analyzing relative volume and momentum over a configurable window, providing a win probability percentage that indicates bullish or bearish confidence. Visual elements include color-coded projection bands (green for bullish, orange for bearish), a median price line, price labels for each percentile, and an info panel displaying Bayesian probability and other metrics.
Key adjustable parameters include the number of simulation iterations, projection horizon, sample depth of historical bars, and classifier window size. The indicator requires bar data with volume and outputs visual projections and directional signals. It is designed to offer a probabilistic framework for anticipating price movement based on recent market behavior, suitable for various symbols including BTCUSD, EURUSD, GBPUSD, XAUUSD, NAS100, and others.
Müşteri değerlendirmeleri
5 | 0 % | |
4 | 100 % | |
3 | 0 % | |
2 | 0 % | |
1 | 0 % |


!["[Hamster-Coder] Moving Average MTF" logosu](https://cdn.ctrader.com/image/webp/b11b98b1-194d-4b8e-b00e-d611826ad159_31226)


