Beschreibung
🚀 Über 10.000 Trader nutzen bereits unsere TOP-Indikatoren 🏆 …und die Community wächst weiter!
Entdecken Sie, warum Profis uns wählen – cTraders leistungsstärkste Werkzeuge (Indikatoren + Algorithmen + cBots) warten auf Sie.
👉 Holen Sie sich hier alle unsere TOP-Systeme:
Pinescriptlabs Store Indikatoren: Pinescriptlabs Store cBots : (cBot) Gold & BTC BreakoutSession Pivots(neu)
Advanced Market Structure: Bos, Choch, SwinLevels, Order Blocks, Market Structure & Liquidity Finder (Neu)
ZigZag Preis-Liquiditätsprojektion
Trailing Smart Algorithm (neu)
Vorhersage basierend auf Linreg & ATR
SmartTrend Unterstützung &
Widerstand
Linien
Dynamische
Marktstruktur
Analyse
von
Wendepunkten
Points
Fibonacci
Lineare
Regression
Multi-Timeframe
Multi-Level
Kerzen-Bias
Tracker
Reaktive gleitende Durchschnittslinie
Auto
Unterstützungs- und
Widerstandslinien
Trend
Linien
Alle
Unterstützungs- und
Widerstandsniveaus
Levels
Markt-Polaritätszonen 📊
Was macht dieser Algorithmus?
Markt-Polaritätszonen ist ein fortschrittlicher Indikator, der die Marktanalyse vereinfacht, indem er automatisch bullische 🚀 oder bärische 🐻 Phasen identifiziert und Schlüsselbereiche markiert, an denen Trendwenden wahrscheinlich sind.
Ideal für:
- Price-Action-Trader
- Swing-Trader
- Scalper,... die schnell die Marktrichtung und präzise Ein- und Ausstiegspunkte erkennen müssen.
Wie funktioniert die Logik?
Der Algorithmus verwendet zwei Hull Moving Averages (HMA) mit unterschiedlichen Perioden, um Momentumverschiebungen zu erkennen, und setzt dynamische Niveaus wie folgt:
- Erkennt HMA-Kreuzungen zur Identifikation von Trendwechseln.
- Setzt automatische Niveaus:
-
- Bullisches Crossover → Markiert das Tief als Unterstützungsniveau
- Bärisches Crossover → Markiert das Hoch als Widerstandsniveau
- Behält das aktive Niveau bis ein neues Crossover auftritt.
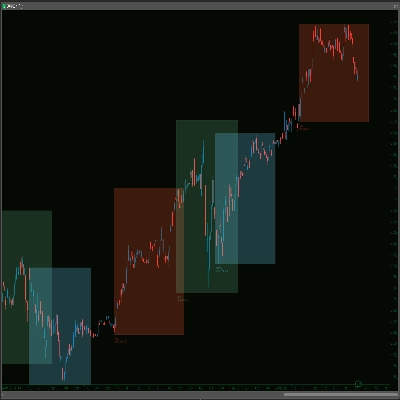
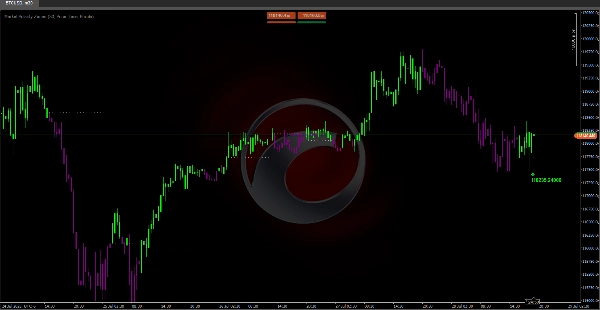
Was Sie in Ihrem Chart sehen werden:
🎨 Intuitives Farbsystem:
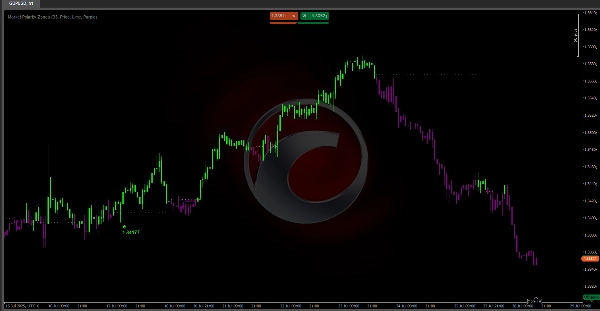
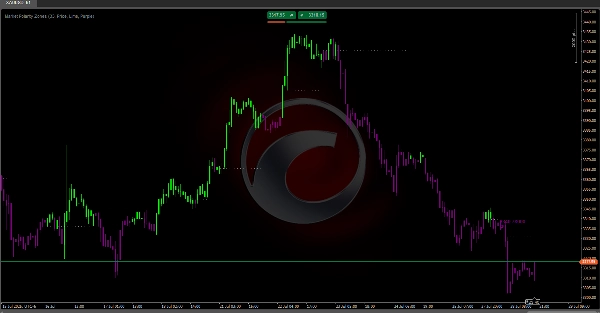
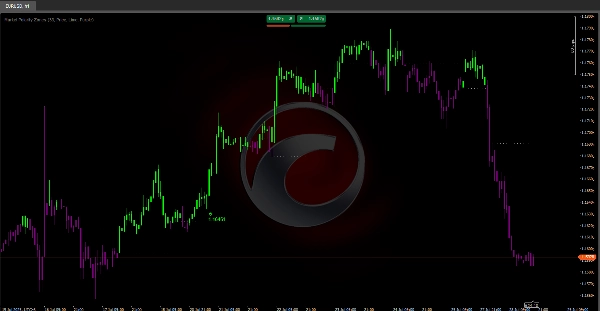
- Grüne Kerzen 🟢: Preis über dem Niveau (bullische Zone – Kaufsignale)
- Lila Kerzen 🟣: Preis unter dem Niveau (bärische Zone – Verkaufssignale)
📉 Dynamische Niveaulinien:
- Gepunktete horizontale Linien markieren das aktive Polaritätsniveau
- Verlängern sich automatisch solange das Niveau gültig bleibt
- Erscheinen nur wenn das Niveau stabil ist
⚠️ Umkehrungsalarme:
Pfeilmarkierungen erscheinen, wenn bestimmte Muster entstehen:
- 🔻 Bärische Umkehr (lila Markierung):
-
- Muster: Preis steigt → scheitert → fällt unter das Niveau
- Bedeutung: Bullischer Druck schwächt sich ab, mögliche Verschiebung in die bärische Zone
- 🔺 Bullische Umkehr (grüne Markierung):
-
- Muster: Preis fällt → prallt ab → steigt über das Niveau
- Bedeutung: Käufer verteidigen das Niveau, mögliche Verschiebung in die bullische Zone
ℹ️ Informationen zu den Markierungen:
- "Preis": Zeigt den genauen Ausbruch-Fehlerpunkt – verwenden Sie ihn für präzise Stopps oder zur Identifikation wichtiger Widerstands-/Unterstützungsbereiche.
- "Volumen": Summe des Volumens der letzten 3 Balken – bestätigt, ob die Umkehr eine echte Marktteilnahme hat.
Empfohlene Einstellungen:
- Länge: 33 (Standard) – Funktioniert gut für die meisten Märkte
- Markierungsdaten: "Preis" für Niveau-Genauigkeit, "Volumen" für Bestätigung
- Farben: Behalten Sie Lime/Lila für den besten visuellen Kontrast 🎨