Mô tả
Xác định các vùng QUAN TÂM CAO CỦA TỔ CHỨC: Nơi có KHỐI LƯỢNG NHIỀU HƠN trong các đợt phá vỡ, có SỰ THAM GIA LỚN HƠN từ CÁC NHÀ ĐẦU TƯ LỚN.
• ⚖️ Đo LƯỢNG CÂN BẰNG QUYỀN LỰC: Xem liệu ÁP LỰC MUA hay BÁN có chiếm ưu thế trong mỗi vùng giá
• 🎯 Phát hiện CÁC MỨC QUAN TRỌNG: Các vùng có KHỐI LƯỢNG PHÁ VỠ CAO HƠN thường đóng vai trò như HỖ TRỢ/KHÁNG CỰ TƯƠNG LAI
• ✅ Xác nhận các chuyển động: Một PHÁ VỠ với KHỐI LƯỢNG CAO có XÁC SUẤT CAO HƠN để là thật
https://chartshots.spotware.com/c/6941a3f65f376
📈 CÁCH ĐỌC NÓ NHƯ THẾ NÀO?
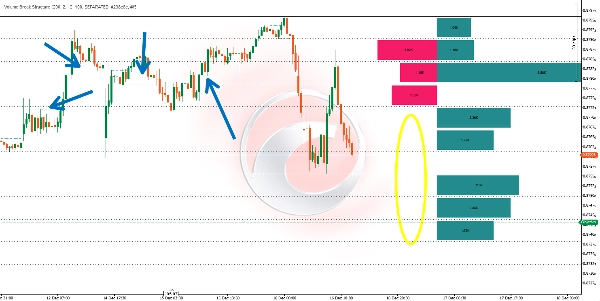
📊 Các Đường Ngang
• Mỗi đường đánh dấu một mức mà một PHÁ VỠ CẤU TRÚC đã xảy ra
• 🟢 PHÁ VỠ TĂNG GIÁ
• 🔴 PHÁ VỠ GIẢM GIÁ
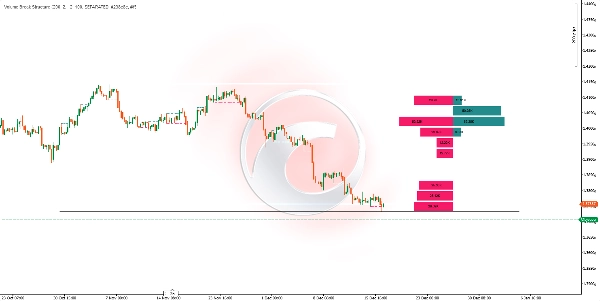
📈 Biểu đồ Histogram
• Nằm ở BÊN PHẢI BIỂU ĐỒ
• Được chia thành CÁC HÀNG đại diện cho CÁC KHOẢNG GIÁ BẰNG NHAU
• 📗 Các thanh ÁP LỰC MUA: KHỐI LƯỢNG TÍCH LŨY của các đợt phá vỡ tăng giá trong vùng đó
• 📕 Các thanh ÁP LỰC BÁN: KHỐI LƯỢNG TÍCH LŨY của các đợt phá vỡ giảm giá trong vùng đó
• ⬆️ Kích thước thanh: Kích thước LỚN HƠN biểu thị KHỐI LƯỢNG PHÁ VỠ LỚN HƠN tại mức đó
https://chartshots.spotware.com/c/6941a4346ede0
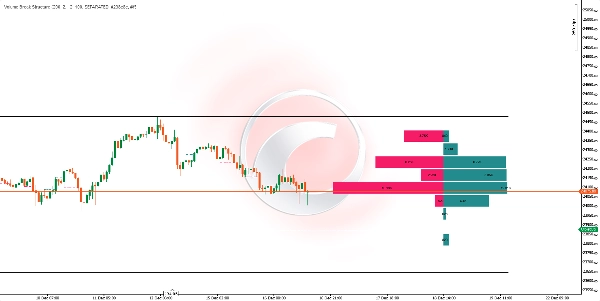
🟦 Lưới
• Các đường trên và dưới LIỀN MẠCH đánh dấu PHẠM VI TỐI ĐA và TỐI THIỂU của khoảng thời gian được phân tích
• Các đường CHẤM chia phạm vi đó thành CÁC PHẦN BẰNG NHAU để dễ đọc hơn
⚙️ 🔧 CÁC THAM SỐ CHÍNH
Tham sốChức năng
🕯️ Số thanh tính toán
Số lượng nến được phân tích NGƯỢC LẠI
🎚️ Độ dài dao động
ĐỘ NHẠY để phát hiện các điểm xoay (CAO HƠN = ít tín hiệu hơn, ĐÁNG TIN CẬY HƠN)
📊 Số hàng Histogram
Số lượng PHÂN CHIA/HÀNG trong biểu đồ histogram
📏 Chiều rộng Histogram
CHIỀU RỘNG HIỂN THỊ của biểu đồ histogram
👁️ Chế độ hiển thị
TÁCH BIỆT (mua/bán) hoặc TỔNG HỢP (tổng khối lượng)
🔄 KHI NÀO NÓ CẬP NHẬT?
🕒 Chỉ báo TỰ ĐỘNG TÍNH TOÁN LẠI khi NẾN đóng cửa, bao gồm bất kỳ PHÁ VỠ CẤU TRÚC MỚI đã xảy ra.
💡 🤝 CÁCH KẾT HỢP NÓ?
📈 Với PHÂN TÍCH XU HƯỚNG
• Trong một XU HƯỚNG TĂNG, tìm các vùng mà KHỐI LƯỢNG ÁP LỰC MUA CHIẾM ƯU THẾ để có thể vào lệnh khi GIẢM GIÁ TẠM THỜI
• Trong một XU HƯỚNG GIẢM, tìm các vùng mà KHỐI LƯỢNG ÁP LỰC BÁN CHIẾM ƯU THẾ để có thể vào lệnh khi TĂNG GIÁ TẠM THỜI
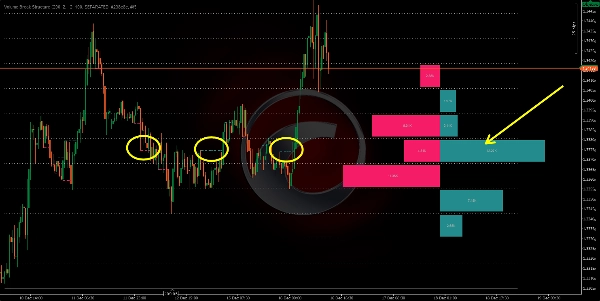
🛡️ Với HỖ TRỢ và KHÁNG CỰ
• Các mức có KHỐI LƯỢNG PHÁ VỠ CAO NHẤT thường trở thành VÙNG PHẢN ỨNG TƯƠNG LAI
• Sử dụng biểu đồ histogram để xác định các vùng được "BẢO VỆ" nhiều nhất bởi người mua hoặc người bán
🌊 Với DÒNG LỆNH
• XÁC NHẬN các tín hiệu từ biểu đồ histogram với các công cụ DÒNG LỆNH THỜI GIAN THỰC
• Các vùng có khối lượng phá vỡ cao thường trùng với CÁC KHU VỰC HẤP THỤ CỦA TỔ CHỨC
🕯️ Với HÀNH ĐỘNG GIÁ
• Tìm các MẪU NẾN trong các vùng mà biểu đồ histogram cho thấy SỰ MẤT CÂN BẰNG ĐÁNG KỂ
• Một MẪU ĐẢO CHIỀU trong vùng có ÁP LỰC MUA CAO có XÁC SUẤT THÀNH CÔNG CAO HƠN
🎯 🚀 DIỄN GIẢI NHANH
Tín hiệu hình ảnhDiễn giải
📗 Thanh MUA lớn, 📕 thanh bán nhỏ
VÙNG CẦU MẠNH, có thể là HỖ TRỢ
📕 Thanh BÁN lớn, 📗 thanh mua nhỏ
VÙNG CUNG MẠNH, có thể là KHÁNG CỰ
⚔️ Cả hai thanh LỚN và tương tự nhau
VÙNG CHIẾN ĐẤU, DỰ KIẾN BIẾN ĐỘNG CAO
⏭️ Hàng không có THANH
VÙNG KHÔNG QUAN TÂM, giá đi qua NHANH CHÓNG
NHỮNG LƯU Ý QUAN TRỌNG
• ❌ Chỉ báo HOẠT ĐỘNG DỰA TRÊN DỮ LIỆU LỊCH SỬ ĐÃ XÁC NHẬN; NÓ KHÔNG DỰ ĐOÁN TƯƠNG LAI
• 📊 SỐ LƯỢNG THANH TÍNH TOÁN CAO HƠN = GÓC NHÌN RỘNG HƠN nhưng có thể LÀM PHÂN TÁN CÁC TÍN HIỆU GẦN ĐÂY
• ⏰ Điều chỉnh Độ dài dao động theo KHUNG THỜI GIAN: GIÁ TRỊ CAO HƠN cho các KHUNG THỜI GIAN CAO HƠN
• 🛡️ LUÔN KẾT HỢP với QUẢN LÝ RỦI RO PHÙ HỢP
Tóm tắt
Key features include:
- Horizontal lines marking bullish (green) and bearish (red) structure breaks.
- A histogram on the right side of the chart divided into rows representing equal price ranges, showing accumulated volume of bullish and bearish breaks. Larger bars indicate higher volume.
- A grid marking the maximum and minimum price range of the analyzed period, divided into equal sections for easier reading.
The indicator recalculates automatically at the close of each candle, updating with any new structure breaks. Main adjustable parameters include the number of bars analyzed backward, swing length sensitivity for pivot detection, histogram rows, histogram width, and display mode (separated buy/sell or aggregated volume).
Volume Break Structure can be combined with trend analysis, support and resistance levels, order flow tools, and price action patterns to confirm market movements and identify potential entry points. It works with confirmed historical data and does not predict future price action.
Đánh giá của khách hàng
5 | 0 % | |
4 | 100 % | |
3 | 0 % | |
2 | 0 % | |
1 | 0 % |


![Logo "[Stellar Strategies] Ultimate Trend & Momentum Dashboard"](https://cdn.ctrader.com/image/webp/e9a9c9e9-4b6c-4bc0-9988-4c4768a23b6c_30290)