Mô tả
https://chartshots.spotware.com/c/695bec6c74055
https://chartshots.spotware.com/c/695bed35bf7b7
https://chartshots.spotware.com/c/695bed6b139df
https://chartshots.spotware.com/c/695bed8ea6bdb
📊 KHỐI PHÁ VỮNG
🤔
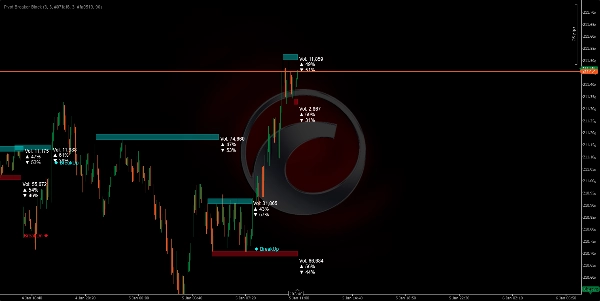
Khối Phá Vững là một chỉ báo trực quan tự động xác định các điểm quay giá quan trọng (đỉnh và đáy cục bộ) và xây dựng "khối giá" xung quanh các mức quan trọng này. Khi giá tiếp cận lại các mức tương tự, thuật toán sẽ vẽ các hình chữ nhật (vùng) đại diện cho kháng cự (Nguồn cung) và hỗ trợ (Nhu cầu) .
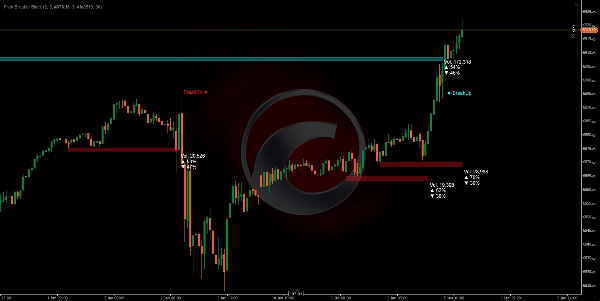
Hệ thống liên tục theo dõi xem giá có phá vỡ qua các vùng này, tạo ra các tín hiệu trực quan rõ ràng: BreakUp (phá vỡ tăng) 🔼 hoặc BreakDn (phá vỡ giảm) 🔽.
MỤC ĐÍCH CỦA NÓ LÀ GÌ? 🎯
1. Xác định các vùng kiểm soát thị trường 🗺️
Thuật toán phát hiện nơi giá đã thể hiện kháng cự mạnh (trần bán) hoặc hỗ trợ (sàn mua). Khi các mức này xuất hiện nhiều lần, thị trường xác nhận tầm quan trọng của chúng.
2. Hiển thị tích lũy và phân phối khối lượng ⚖️
Mỗi khối hiển thị:
- Tổng khối lượng xử lý trong vùng đó
- % mua (nến tăng) 📈
- % bán (nến giảm) 📉
Điều này cho phép bạn thấy liệu thị trường đang mua hay bán trong khu vực đó, tiết lộ ý định của thị trường.
3. Dự đoán điểm phá vỡ 🚨
Khi giá tiếp cận các vùng này, bạn có xác suất cao nhất xảy ra một biến động đáng kể. Thuật toán tự động phát hiện khi giá phá vỡ qua chúng, cảnh báo bạn trong thời gian thực.
CÁCH HOẠT ĐỘNG CỦA LOGIC ⚙️
Giai đoạn 1: Phát hiện điểm Pivot (Điểm quay) 🔍
Thuật toán tìm các đỉnh và đáy đáp ứng tiêu chí cụ thể:
- Pivot High: Một cây nến có đỉnh cao hơn so với 5 cây nến trước đó VÀ 5 cây nến sau đó.
- Pivot Low: Một cây nến có đáy thấp hơn so với 5 cây nến trước đó VÀ 5 cây nến sau đó.
Tham số "5" này (Pivot Lookback) có thể điều chỉnh theo độ biến động bạn muốn bắt.
Giai đoạn 2: Nhận diện vùng kiểm soát 🎯
Khi một pivot được xác định, hệ thống so sánh nó với pivot trước đó cùng loại. Nếu sự khác biệt giữa chúng nhỏ hơn 20% của ATR (đo lường biến động hiện tại), điều đó có nghĩa là thị trường đang quay lại một mức tương tự đã bị từ chối trước đó.
Giai đoạn 3: Định kích thước vùng 📏
Chiều cao mỗi khối được tính toán động sử dụng ATR (Average True Range):
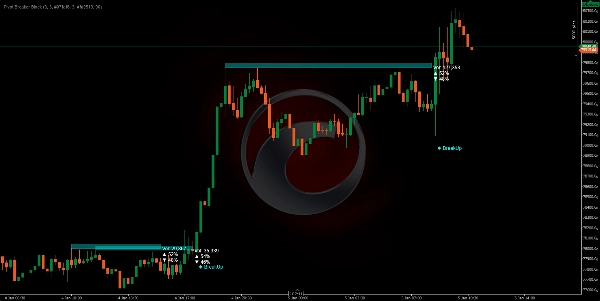
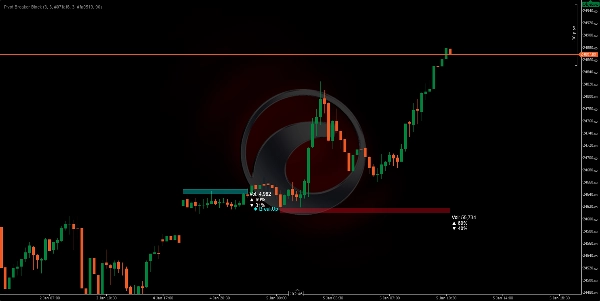
- Nguồn cung (Đỏ): Trần là ATR × 0.5 điểm phía trên pivot.
- Nhu cầu (Xanh lam): Sàn là ATR × 0.5 điểm phía dưới pivot.
Điều này có nghĩa là các vùng tự động thích nghi theo biến động của tài sản. Trong thị trường biến động, vùng rộng hơn; trong thị trường yên tĩnh, vùng hẹp hơn.
Giai đoạn 4: Phân tích khối lượng thời gian thực 💹
Khi giá nằm trong vùng, thuật toán tổng hợp tất cả khối lượng mua và bán kể từ khi khối bắt đầu:
- Mua: Tất cả các nến có giá đóng cửa lớn hơn giá mở (khối lượng tăng).
- Bán: Tất cả các nến có giá đóng cửa nhỏ hơn giá mở (khối lượng giảm).
Các tỷ lệ phần trăm này cho bạn thấy ý định chiếm ưu thế trong vùng đó.
Giai đoạn 5: Phát hiện phá vỡ 🚀
Thuật toán theo dõi từng cây nến mới:
- BreakUp (↑): Giá đóng cửa vượt lên trên trần Nguồn cung → Tín hiệu phá vỡ tăng.
- BreakDn (↓): Giá đóng cửa giảm xuống dưới sàn Nhu cầu → Tín hiệu phá vỡ giảm.
Khi điều này xảy ra, khối bị vô hiệu hóa và một tín hiệu văn bản xuất hiện trên màn hình.
CÁCH SỬ DỤNG 🛠️
Cài đặt và cấu hình ⚙️
- Thêm chỉ báo vào nền tảng cTrader của bạn.
- Truy cập các tham số có thể điều chỉnh:
Tham sốÝ nghĩaKhuyến nghị
Pivot Lookback
Số lượng nến bên trái/phải được đánh giá để xác nhận một pivot
5 (tiêu chuẩn), tăng trên các khung thời gian cao hơn
Hệ số vùng Nguồn cung
Chiều cao khối đỏ (Kháng cự)
5.0 (tiêu chuẩn), điều chỉnh theo sở thích
Hệ số vùng Nhu cầu
Chiều cao khối xanh lam (Hỗ trợ)
5.0 (tiêu chuẩn), điều chỉnh theo sở thích
Độ trong suốt
Độ mờ của khối (0=ẩn, 255=rõ)
90 (khuyến nghị để dễ nhìn)
Màu sắc
Tùy chỉnh giao diện trực quan
Màu đỏ cho Nguồn cung, màu xanh lam cho Nhu cầu
Chiến lược giao dịch 💡
Kịch bản 1: Vào lệnh mua (Long) 📈
- Chờ giá tạo ra một khối Nhu cầu (xanh lam) với % mua > 55%.
- Khi thấy BreakUp, xác nhận vào lệnh mua của bạn.
- Dừng lỗ (SL) dưới sàn khối.
Kịch bản 2: Vào lệnh bán (Short) 📉
- Tìm một khối Nguồn cung (đỏ) với % bán > 55%.
- Khi BreakDn, mở vị thế bán.
- Dừng lỗ (SL) trên trần khối.
Kịch bản 3: Đảo chiều (Quay về trung bình) 🔄
- Nếu giá nằm trong một khối Nhu cầu nhưng % mua thấp (< 45%)...
- Dự đoán giá sẽ bật lên mà không đạt BreakUp.
- Vào lệnh mua gần sàn với chốt lời (TP) tại trần.
Khung thời gian tối ưu ⏰
- H4/D1: Các khối lớn hơn, các biến động kéo dài hơn.
- H1: Cân bằng tốt giữa nhiễu và cơ hội.
- M15: Vào lệnh nhanh, cần xác nhận khối lượng.
Tóm tắt
The indicator continuously monitors price action relative to these zones, providing real-time breakout signals: "BreakUp" for bullish breakouts above resistance and "BreakDn" for bearish breakouts below support. Each block displays cumulative volume data, including total volume processed and the percentage of buying (bullish) versus selling (bearish) activity, helping traders assess market intention within these areas.
Pivot Breaker Block supports multiple trading strategies, including breakout entries and mean reversion, with configurable parameters such as pivot lookback period, zone height factors, and visual transparency. It is suitable for various markets including Forex, indices, commodities, stocks, and cryptocurrencies, and works effectively on timeframes from 15 minutes to daily charts.
Key features:
- Automatic pivot detection with adjustable lookback
- Dynamic supply and demand zone sizing based on ATR
- Real-time volume accumulation and buy/sell ratio visualization
- Breakout alerts with on-screen signals
- Supports multiple asset classes and timeframes for versatile use