
Mô tả
Apex Break PRO vẽ các đường xu hướng quan trọng và ghi điểm mỗi lần chúng bị phá vỡ.
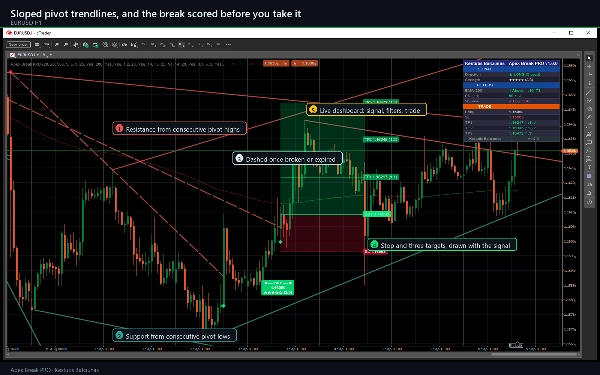
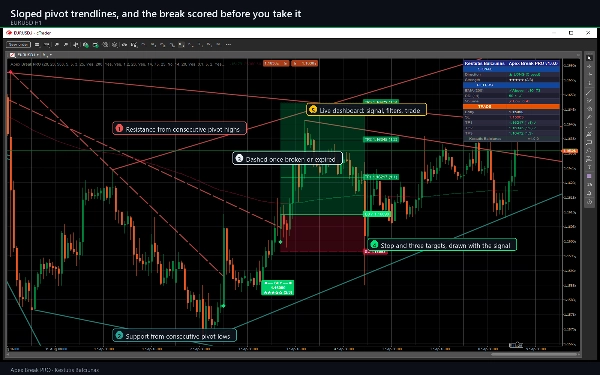
Các đỉnh pivot liên tiếp tạo thành một đường kháng cự nghiêng, các đáy pivot liên tiếp tạo thành một đường hỗ trợ nghiêng. Đây không phải là các mức ngang: chúng theo hướng riêng của thị trường và có thời hạn. Một tín hiệu xuất hiện khi giá đóng cửa của một thanh ĐÃ XÁC NHẬN vượt qua một trong những đường đó với biên độ đo bằng ATR, và chỉ khi đủ các bộ lọc độc lập đồng thuận.
Những gì nó vẽ trên biểu đồ của bạn
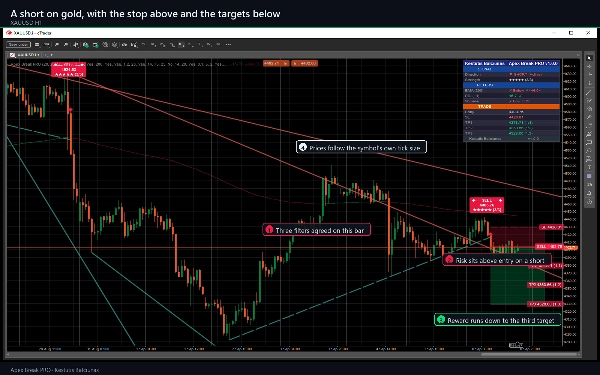
- Các đường xu hướng kháng cự và hỗ trợ nghiêng, tối đa năm đường mỗi loại, liền nét khi còn hiệu lực và nét đứt khi bị phá vỡ hoặc đã hết phần mở rộng.
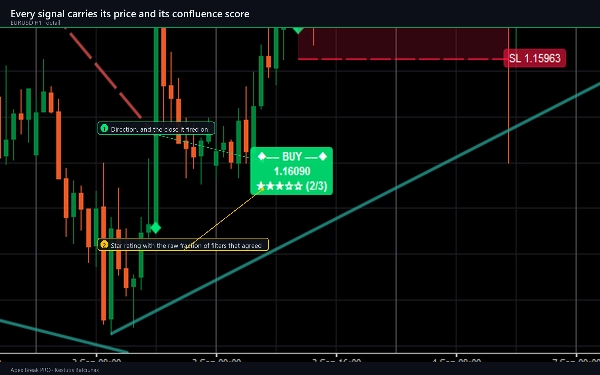
- Một dấu hiệu MUA hoặc BÁN với nhãn mang giá, đánh giá năm sao và tỷ lệ hội tụ, ví dụ 3/4.
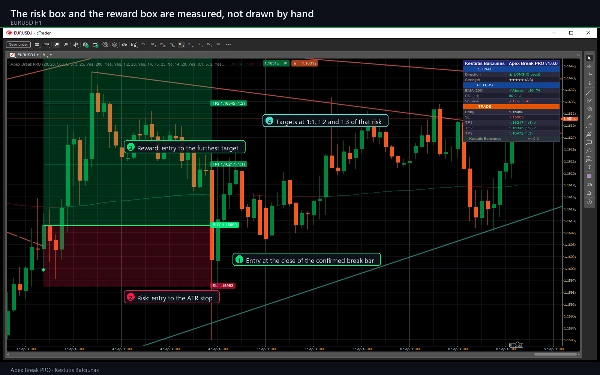
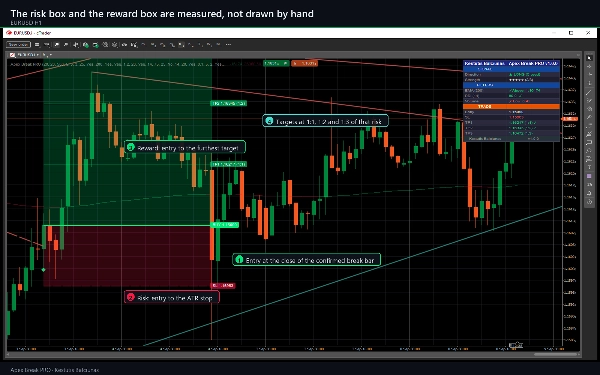
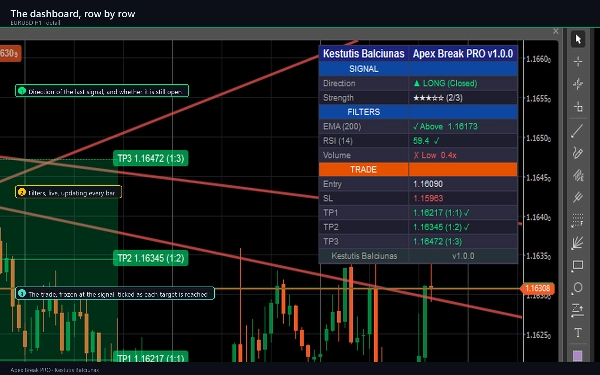
- Điểm dừng, mặc định là 1,5 x ATR, và ba mục tiêu ở tỷ lệ 1:1, 1:2 và 1:3 của khoảng cách đó, với vùng rủi ro được tô bóng và vùng lợi nhuận được tô bóng.
- Đường EMA 200, được tô màu theo phía mà giá đang giao dịch.
- Bảng điều khiển hai cột với phần TÍN HIỆU, phần BỘ LỌC trực tiếp và phần GIAO DỊCH đánh dấu từng mục tiêu khi đạt được.
Cách giao dịch với nó
- Cung cấp lịch sử cho nó. Với cài đặt mặc định, nó cần khoảng 250 thanh trước khi đường đầu tiên xuất hiện, vì EMA 200 phải được thiết lập và một pivot chỉ được xác nhận sau 20 thanh kể từ khi hình thành.
- Chờ một dấu hiệu. Việc phá vỡ được đánh giá trên thanh đã đóng, vì vậy dấu hiệu không di chuyển sau khi được in ra.
- Đọc đánh giá sao và các hàng BỘ LỌC trước khi hành động. Điểm số cho biết có bao nhiêu điều kiện được bật đồng thuận trên thanh đó. Đây là mô tả sự đồng thuận, không phải xác suất.
- Sử dụng điểm dừng và mục tiêu đã vẽ như hiện có, hoặc làm mẫu cho kích thước của riêng bạn.
- Theo dõi các hàng GIAO DỊCH. Mỗi mục tiêu được đánh dấu khi giá đạt tới, và việc theo dõi dừng lại ở điểm dừng hoặc mục tiêu thứ ba.
- Bật các cảnh báo bạn muốn. Có chín sự kiện riêng biệt có sẵn.
Cài đặt chính
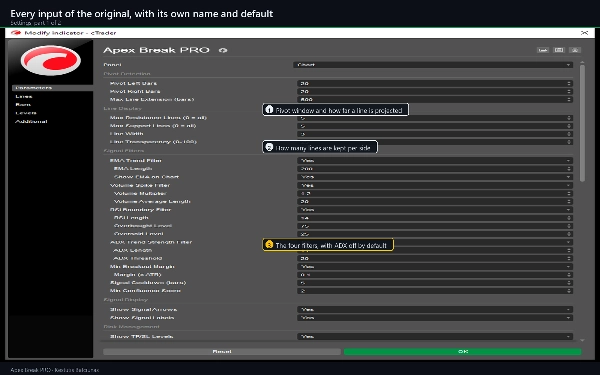
- Phát hiện Pivot: thanh bên trái và bên phải, đều là 20, và phần mở rộng đường tối đa là 500 thanh.
- Hiển thị đường: tối đa 5 đường kháng cự và 5 đường hỗ trợ, độ rộng 3, độ trong suốt 25.
- Bộ lọc tín hiệu: EMA 200; RSI 14 với giới hạn 75 và 25; khối lượng 1.2x trung bình 20 thanh; ADX 14 trên 20, mặc định tắt; biên độ phá vỡ 0,1 x ATR; thời gian chờ 5 thanh; điểm số tối thiểu 2.
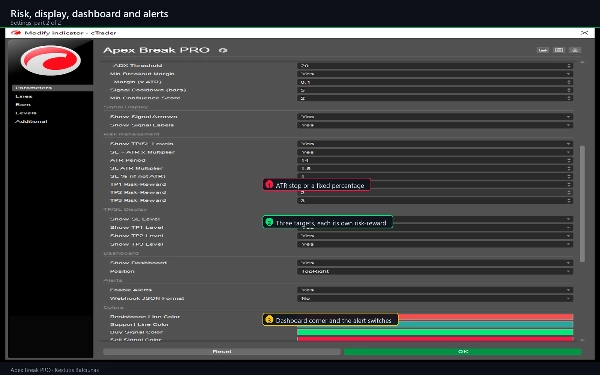
- Quản lý rủi ro: ATR 14, điểm dừng ở 1,5 x ATR hoặc phần trăm cố định, mục tiêu ở tỷ lệ 1:1, 1:2 và 1:3.
- Bảng điều khiển ở sáu vị trí, chín công tắc cảnh báo, và bốn màu đường và tín hiệu.
Tổng cộng 65 tham số, bao gồm phát hiện pivot, hiển thị đường, bộ lọc tín hiệu, quản lý rủi ro, hiển thị TP/SL, bảng điều khiển, chín công tắc cảnh báo với các kênh gửi, và màu sắc.
Loại chỉ báo, khung thời gian, công cụ, trường hợp sử dụng
Một chỉ báo hỗ trợ và kháng cự, xu hướng và biến động vẽ trên biểu đồ chính và phát tín hiệu. Nó chạy trên bất kỳ ký hiệu và khung thời gian nào. M15, H1 và H4 là khung thời gian thiết kế chính; các khung thời gian thấp hơn cho nhiều tín hiệu hơn với điểm dừng ATR chặt hơn, D1 trở lên cho ít tín hiệu hơn và rộng hơn. Bộ lọc khối lượng được sử dụng khi nhà môi giới cung cấp khối lượng và có thể tắt khi không có. Các ứng dụng điển hình: vào lệnh phá vỡ đường xu hướng với tỷ lệ hội tụ đã nêu, đặt điểm dừng dựa trên ATR, thoát lệnh theo giai đoạn ở tỷ lệ 1:1, 1:2 và 1:3, xác nhận khung thời gian cao hơn, và cung cấp tín hiệu cho cBot từ đầu ra tín hiệu ẩn.
Dành cho ai
Các nhà giao dịch đã vẽ đường xu hướng bằng tay và muốn chúng được vẽ giống nhau trên mọi biểu đồ, mọi lúc, với điểm phá vỡ được đánh giá trước khi họ hành động. Đây là công cụ phân tích: nó không bao giờ đặt, sửa đổi hoặc đóng lệnh, và không có quyền truy cập vào tài khoản của bạn.
Phiên bản thử nghiệm: những gì phiên bản đầy đủ bổ sung
Phiên bản thử nghiệm là bản dựng giống nhau này, giới hạn trên EURUSD, không giới hạn thời gian và có tất cả các tham số. Trên bất kỳ ký hiệu nào khác, nó hiển thị thông báo thay vì vẽ. Phiên bản đầy đủ bỏ khóa ký hiệu: mọi cặp forex, chỉ số, kim loại, năng lượng và tiền điện tử mà nhà môi giới của bạn cung cấp.
Ghi chú kỹ thuật và hạn chế
- Tín hiệu được đánh giá trên các thanh đã đóng và không vẽ lại. Một pivot chỉ được xác nhận sau khi các thanh Pivot Right Bars đã hình thành, và độ trễ xác nhận đó là cái giá của việc không vẽ lại. Các đường xu hướng tự nó là tạm thời trên thanh đang hình thành.
- Cảnh báo chỉ kích hoạt cho các thanh đóng sau khi bạn gắn chỉ báo, không bao giờ cho lịch sử.
- Các dấu trên hàng mục tiêu ghi lại rằng giá sau đó đã chạm mức đã vẽ trên lịch sử trong biểu đồ của bạn. Chúng không phải kết quả giao dịch: không có spread, hoa hồng, swap, trượt giá hay khớp lệnh liên quan, và không có thống kê nào được rút ra từ chúng.
- Biểu đồ giữ lại các nhãn tín hiệu và đường xu hướng gần đây nhất và loại bỏ những cái cũ hơn.
- Hai nhà môi giới không có nến giống hệt nhau, vì vậy tín hiệu trên biểu đồ trực tiếp sẽ khác với cùng chỉ báo trên nguồn dữ liệu khác. Đó là sự khác biệt về dữ liệu, không phải sự khác biệt về tính toán.
- Yêu cầu: cTrader 5.0 hoặc mới hơn, đã thử nghiệm trên 5.9. Quyền truy cập: Không - không có quyền truy cập file, mạng hoặc giao dịch.
Hỗ trợ
Các câu hỏi qua tab Thảo luận của trang này hoặc Hỏi người bán. Cập nhật miễn phí và được liệt kê trong lịch sử phiên bản. Cửa hàng cung cấp thời gian hoàn tiền 14 ngày. Nếu chỉ báo hoạt động với bạn, một đánh giá sẽ giúp các nhà giao dịch khác tìm thấy nó.
Giao dịch có rủi ro. Hiệu suất trong quá khứ không đảm bảo kết quả tương lai.
Tóm tắt
Key features include visual BUY/SELL markers with price labels, star ratings indicating filter confluence, ATR-based stops (default 1.5x ATR), and three profit targets at 1:1, 1:2, and 1:3 risk-reward ratios. It also displays a 200 EMA colored by price position, shaded risk and reward zones, and a two-column dashboard showing live signals, filters, and trade progress.
Signals are generated on confirmed closed bars without repainting, and alerts can be configured for nine different events. The indicator supports volume filtering where available and includes 65 customizable parameters covering pivot detection, line display, filters, risk management, and alerts. Apex Break PRO is intended for traders who manually draw trendlines and seek consistent, scored breakout signals for analysis and trade planning. It does not execute trades or access accounts.

















![Logo "High-Low Divergence [Iridio Capital]"](https://cdn.ctrader.com/image/webp/10a9e91b-243a-43f6-bbfe-7376bad5a214_61554)