

الوصف
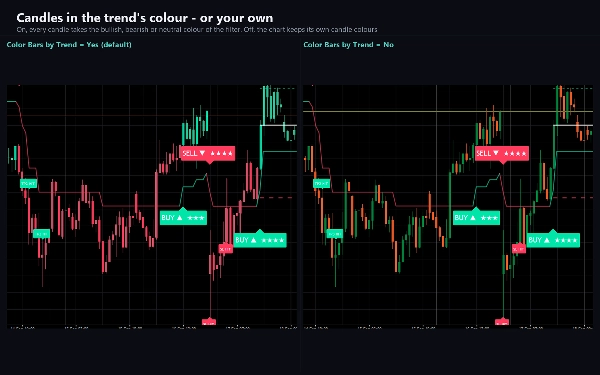
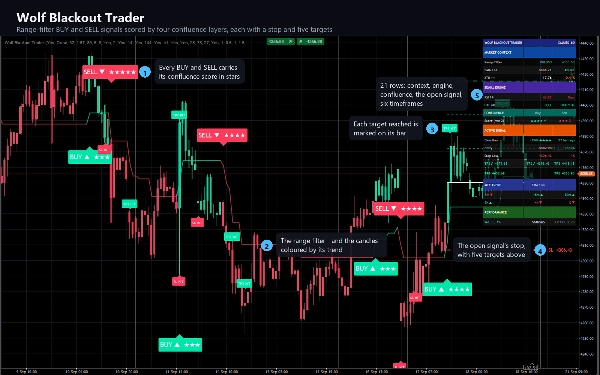
Wolf Blackout Trader follows one range filter and recolours every candle by its trend, so the chart
reads bullish, bearish or neutral at a glance. When the trend turns, the turn is scored by four
confluence layers, and only a turn with enough agreement becomes a BUY or SELL signal. Every signal
arrives with a stop, five targets and a star rating.
WHAT IT DRAWS
- Candles recoloured by trend: bullish, bearish or neutral, in the colours you choose.
- The range filter line in the same colours.
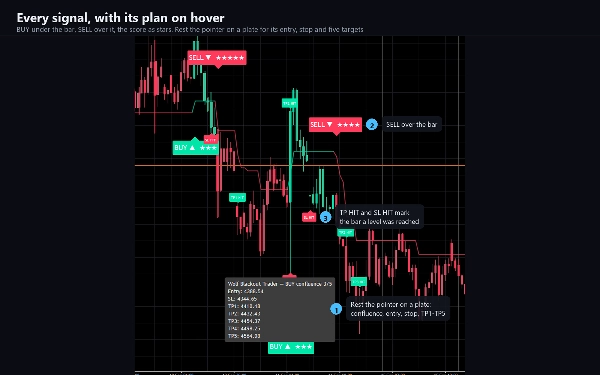
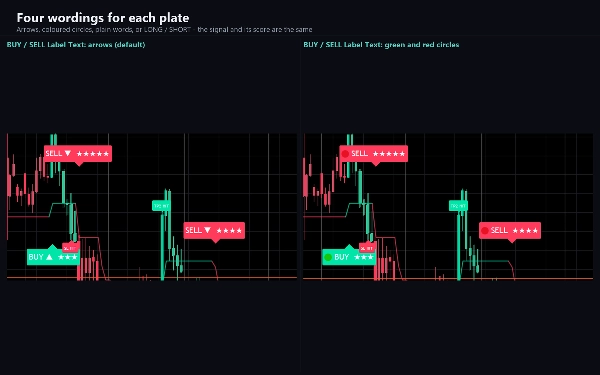
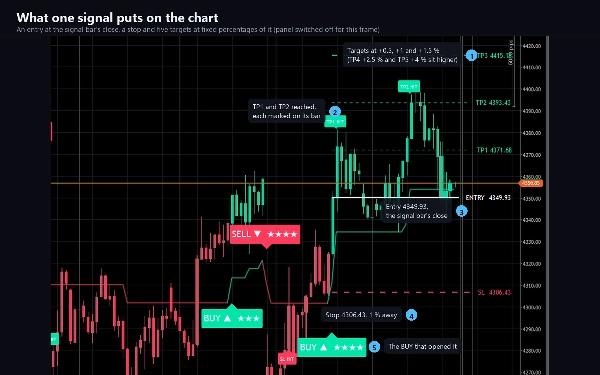
- A plate on every signal bar - BUY below the candle, SELL above it - with one to five stars. Rest the
pointer on a plate to see its score, entry, stop and all five targets.
- For the open signal: an entry line, a stop and five targets, each with a price tag. A small label
marks every target reached and the stop when it is reached.
- Small diamonds at momentum extremes: under the bar when a slow RSI is deeply oversold and still
weakening, over the bar when it is overbought and still strengthening.
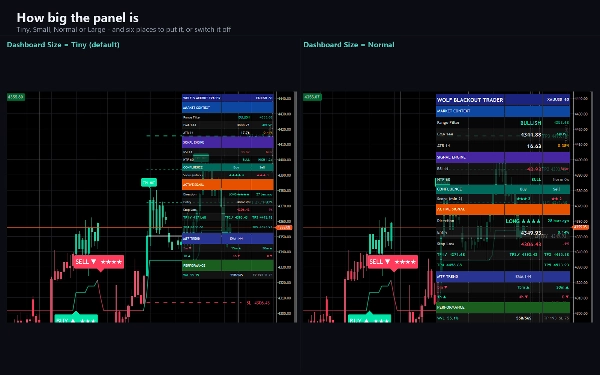
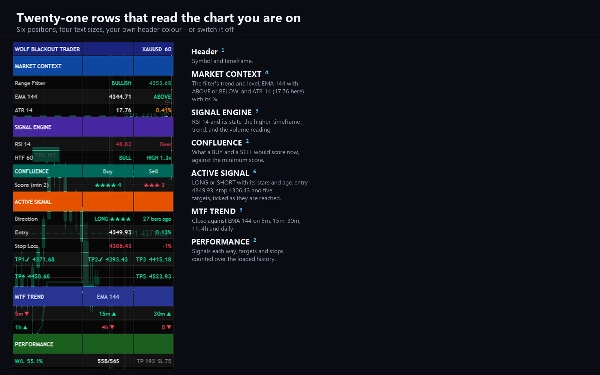
- A twenty-one-row panel: the market context (trend, EMA, ATR), the signal engine (RSI, the
higher-timeframe reading and the volume reading), the score a BUY and a SELL would get right now,
the active signal with its entry, stop and targets ticked as they are reached, a trend block for six
timeframes from five minutes to daily, and a running count of signals, targets and stops.
HOW IT DECIDES
The filter moves only when price leaves a band around it. Its band is the average of a fast and a slow
smoothed range, so it ignores small noise and follows real moves. A BUY trigger is the first bar that
turns bullish after a bearish stretch, and a SELL trigger the reverse.
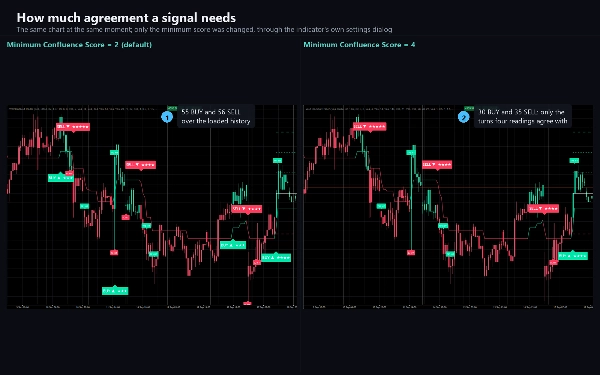
Each trigger scores one point, plus one for each layer that agrees: RSI on the right side of 50, close
on the right side of a 144 EMA, the same EMA test on a higher timeframe you choose (one hour by
default), and a volume burst above its 20-bar average. A trigger becomes a signal when it reaches the
minimum score (two by default) and enough bars have passed since the last signal in that direction.
By default a signal is decided when its bar closes. A layer you switch off always adds its point.
The stop and the five targets are fixed percentages of the entry price, all adjustable. Reaching the
fifth target closes the trade as a win. The stop closes it as a win if the first target was reached
before, otherwise as a loss. A new signal replaces the open one.
KEY SETTINGS
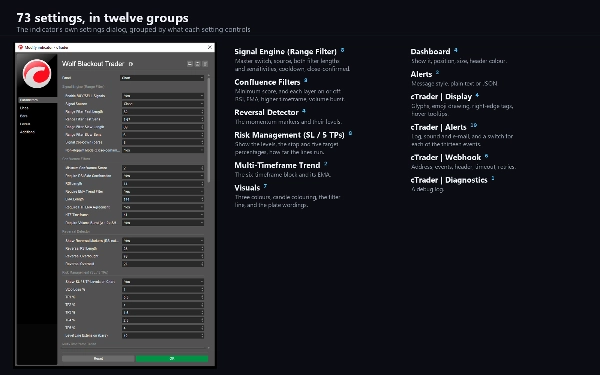
73 in twelve groups: the signal source, both filter lengths and sensitivities, the cooldown and the
close-confirmed mode; the minimum score, each confluence layer on or off, the RSI and EMA lengths and
the higher timeframe; the momentum markers and their levels; the stop and five target percentages and
how far the level lines run; the trend block's EMA length; three colours, candle colouring, the filter
line and four wordings for each plate; the panel's position, size and header colour; the alert message
style; and groups for display, alerts, the webhook and diagnostics.
ALERTS AND WEBHOOK
Thirteen events, each with its own switch: BUY, SELL, either signal, a five-star BUY or SELL, each
momentum marker, each of the five targets, and the stop. Delivered as a cTrader log line, a sound of
your choice, and e-mail. A signal alert carries the entry, the stop, all five targets and the score.
Nothing fires while the indicator walks the chart's history, and nothing fires in a backtest.
A webhook posts signals - and, if you choose, targets, stop and marker events - as JSON to any address
you enter: a trading bot, a journal, a relay, an automation flow. It stays off until you enter one, it
is deduplicated per event per bar, capped at twenty messages a minute, and a failure is logged rather
than thrown. It sends through cTrader's own networking service, which is why the indicator needs no
file or network access rights at all.
TYPE AND WINDOW
An overlay indicator: everything is drawn on the price chart, and it adds no separate pane.
TIMEFRAMES AND INSTRUMENTS
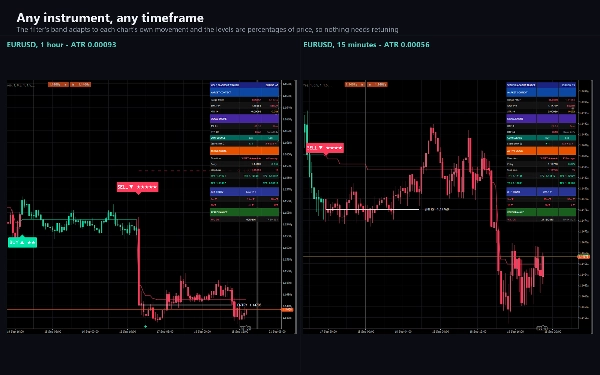
Any time-based timeframe and any instrument. The band adapts to each chart's own movement, the levels
are percentages of the price, and prices are formatted to your broker's own tick. The indicator loads
the other timeframes it reads by itself.
USE CASES
- Reading the trend of any chart from the colour of its candles.
- Taking only the turns that several independent readings agree with.
- Turning each signal into a plan: one stop and five targets, drawn in advance.
- Checking six timeframes at once in the panel.
- Being told by log line, sound, e-mail or webhook when a signal fires or a target is reached.
WHO IT IS FOR
Traders who want clear buy and sell points with a trend filter behind them, and anyone who wants a
signal to arrive with a stop and a ladder of targets rather than an arrow.
TRIAL
The free trial is the full indicator on EURUSD only - every broker suffix works. On any other symbol
it shows a notice and draws nothing. No time limit, no reduced history, no missing features. The full
version removes the symbol restriction and changes nothing else.
TECHNICAL NOTES AND LIMITATIONS
Access rights: none. The indicator cannot read files, start processes or open connections of its own.
It is a charting and analysis tool. It does not place orders and it has no access to your account.
The volume layer reads your broker's tick volume, so on a different feed it can decide differently
whether a turn reaches the minimum score. The higher-timeframe layer reads the developing
higher-timeframe bar while the chart runs and completed bars after the chart reloads, so a signal
from a live session can move after a reload. Target and stop checks and the momentum markers update
as the bar forms. The filter settles over the first few hundred bars of a chart, so load some history
before reading its earliest signals.
The panel's PERFORMANCE row counts what the drawn levels met on the bars your chart has loaded. A stop
reached after the first target counts as a win, and a signal replaced by the next one is not counted.
It is a description of that history, not a backtest and not a forecast.
SUPPORT
Questions go through the Discussion tab. Include your broker, symbol, timeframe, cTrader version and
a screenshot of the whole chart, and you will get a useful answer first time.
Trading involves risk. Past performance does not guarantee future results.





























