SmartFibonacci — Automatic, configurable Fibonacci retracements & extensions with higher-timeframe support, price labels and proximity alerts for faster, more confident trade decisions.
Store-ready short description (1–2 lines)
SmartFibonacci automatically detects swing high/low points and draws clear Fibonacci retracements and optional extensions on your chart. Configurable lookback, higher-timeframe swing detection, labeled prices/percents and proximity alerts make it ideal for both intraday scalping and swing setups.
Full product description (copy-paste ready for cTrader Store)
SmartFibonacci is a lightweight, performance-focused cTrader indicator that automates Fibonacci analysis so you can spend less time drawing levels and more time trading. It locates the most recent swing high and swing low within a configurable lookback, draws retracement levels and optional projection (extension) levels, and displays price and percentage labels for fast interpretation. For robust signals, SmartFibonacci can calculate swing points on a higher timeframe while rendering levels on your current chart. Built-in alerts (popup + sound) notify you when price comes within a configurable pip distance of any visible Fibonacci level.
This listing includes: clear screenshots showing key UI elements, example workflows, configuration settings, and sample outputs (price labels, extensions, alerts) to make it easy for buyers to evaluate functionality and UX before purchase.
Key features
- Automatic swing detection — finds the most recent swing high/low within a configurable lookback window.
- Higher timeframe swing option — compute swing pivots on a higher timeframe for smoother, more meaningful levels.
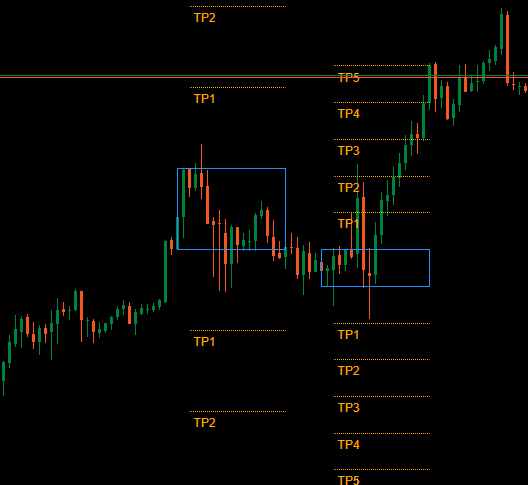
- Retracements & Extensions — draw standard retracement lines and optional projection (extension) levels (user-definable percentages such as 127.2, 161.8, etc.).
- Price & percent labels — each visible level shows its percent and the exact price for quick decision making.
- Customizable visuals — set colors (retracement / extension), line thickness and line style.
- Proximity alerts — popup + sound when price enters a configurable pip radius of a visible Fibonacci level; option to alert only the closest level.
- Efficient redraw logic — indicator redraws only when the swing pivots change to reduce chart clutter and CPU usage.
- Safe defaults — sensible defaults for traders who want immediate use after installation.
- Compatible with cTrader / cAlgo — designed to run as an overlay indicator.
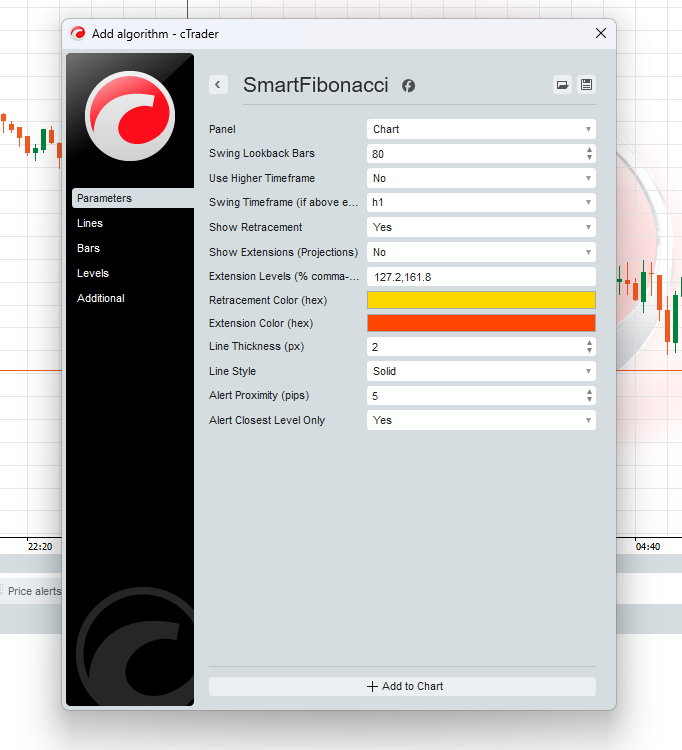
Configuration (parameters & explanations)
- Swing Lookback Bars (int) — how many bars to search back to find swing high/low (default 80).
- Use Higher Timeframe (bool) — enable detection on a higher TF while drawing on the current chart.
- Swing Timeframe (TimeFrame) — the higher timeframe to use when
Use Higher Timeframeis enabled. - Show Retracement (bool) — toggle drawing of retracement levels.
- Show Extensions (bool) — toggle drawing of extension/projection levels.
- Extension Levels (string) — comma-separated percent values (e.g.,
127.2,161.8) used to populate projection lines. - Retracement Color / Extension Color (hex) — pick colors for retracement and extension lines.
- Line Thickness (px) — integer line thickness setting.
- Line Style (enum) — choose solid, dashed etc.
- Alert Proximity (pips) — distance in pips for proximity alerts.
- Alert Closest Level Only (bool) — when enabled, only the nearest fib level triggers the popup.
Analytical outputs & UX elements
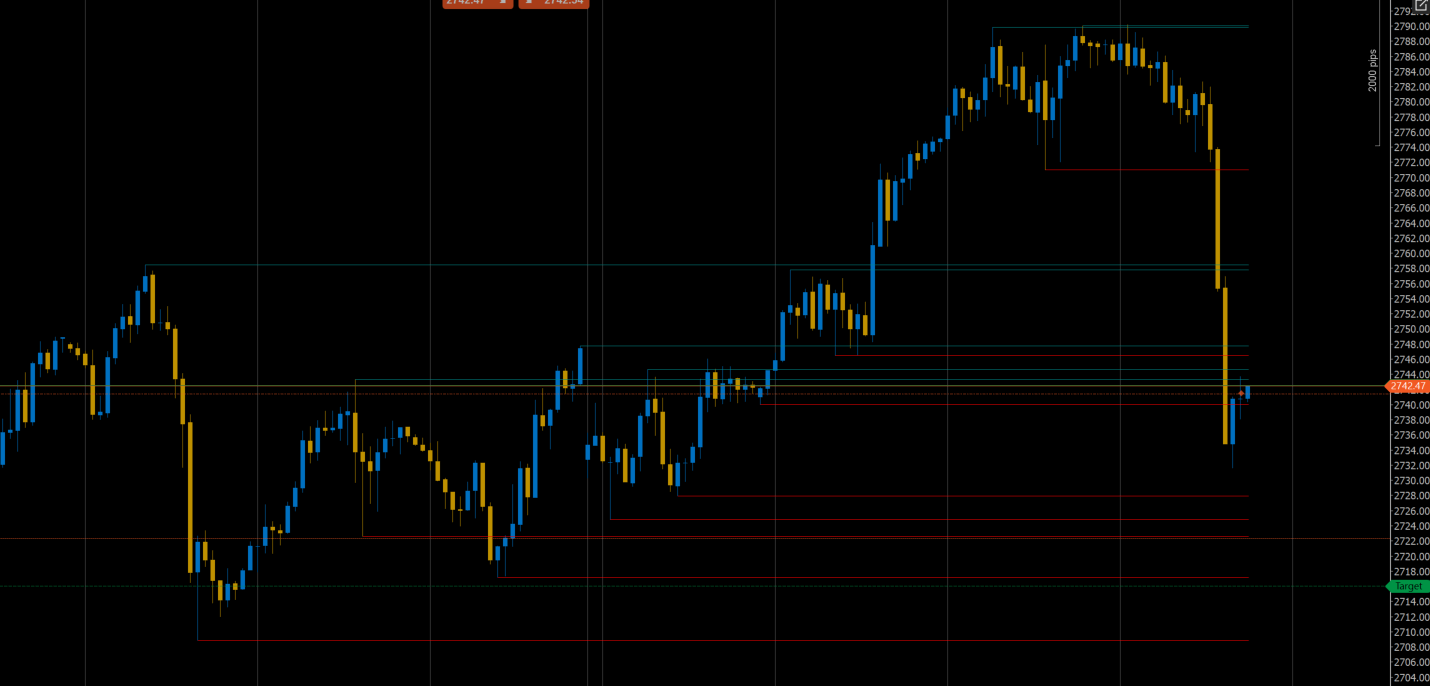
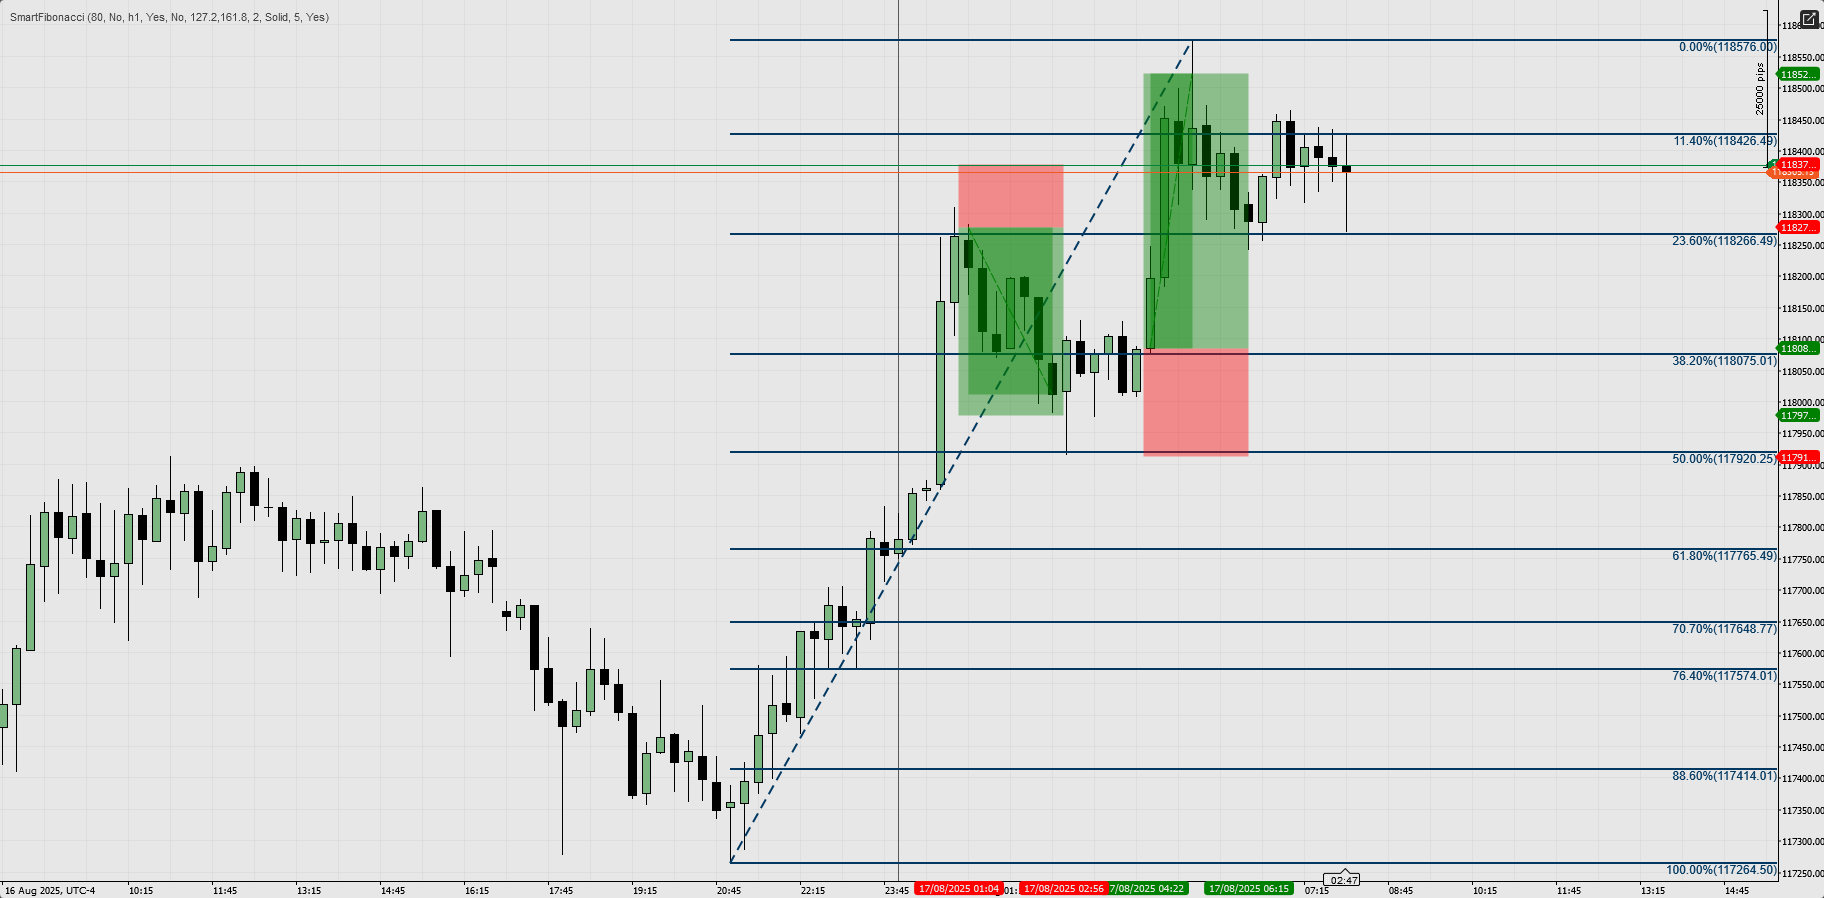
- On-chart lines — retracement and extension lines with clear percent labels (e.g., 61.8%) and price labels (e.g., 1.23456).
- Popup notifications — user receives an on-screen popup and the system sound when the price enters the
Alert Proximityarea. - Non-intrusive redraws — only updates when the detected swing changes to avoid frequent redraw flicker.
- Price source consistency — alerts and labels are calculated using the same Bars series that the fib was drawn on (important when using higher timeframe calculation).
Example workflows / usage scenarios
- Quick setup (scalping / intraday)
- Attach SmartFibonacci to a 5-minute chart, set
Lookback = 80,ShowRetrace = true. - Watch retracement levels and use 61.8% / 50% as intraday reaction zones.
- Enable
Alert Proximity = 5 pipsto get notified when price approaches important levels.
- Attach SmartFibonacci to a 5-minute chart, set
- Higher-timeframe context (swing trading)
- Set
Use Higher Timeframe = trueand selectHigher Timeframe = H4(or Daily). - Levels reflect H4 swings while you trade on H1 or M30 — better alignment with higher TF structure.
- Use extensions (127.2, 161.8) as profit targets for swing trades.
- Set
- Validation + confluence
- Combine SmartFibonacci levels with your existing support/resistance, structure breaks, or moving averages to validate entries.
- Use the popup alerts to time entries or journal the interactions for backtesting.
- Alert-driven workflows
- Keep the indicator on while monitoring multiple charts; receive popups when price nears any configured visible fib level and act accordingly.


.jpeg)


.png)