Indicator
Grid
NAS100
NZDUSD
Breakout
XAUUSD
Commodities
Martingale
Forex
Signal
EURUSD
GBPUSD
BTCUSD
Indices
Prop
Stocks
Crypto
USDJPY
Scalping
RangeBoxLevel
"RangeBoxLevel" logo
5.0
23/09/2025
18
Desktop
Since 22/09/2024
Sales
91
Free installs
8383
"RangeBoxLevel" uploaded image"RangeBoxLevel" uploaded image"RangeBoxLevel" uploaded image"RangeBoxLevel" uploaded image"RangeBoxLevel" uploaded image"RangeBoxLevel" uploaded image"RangeBoxLevel" uploaded image"RangeBoxLevel" uploaded image"RangeBoxLevel" uploaded image

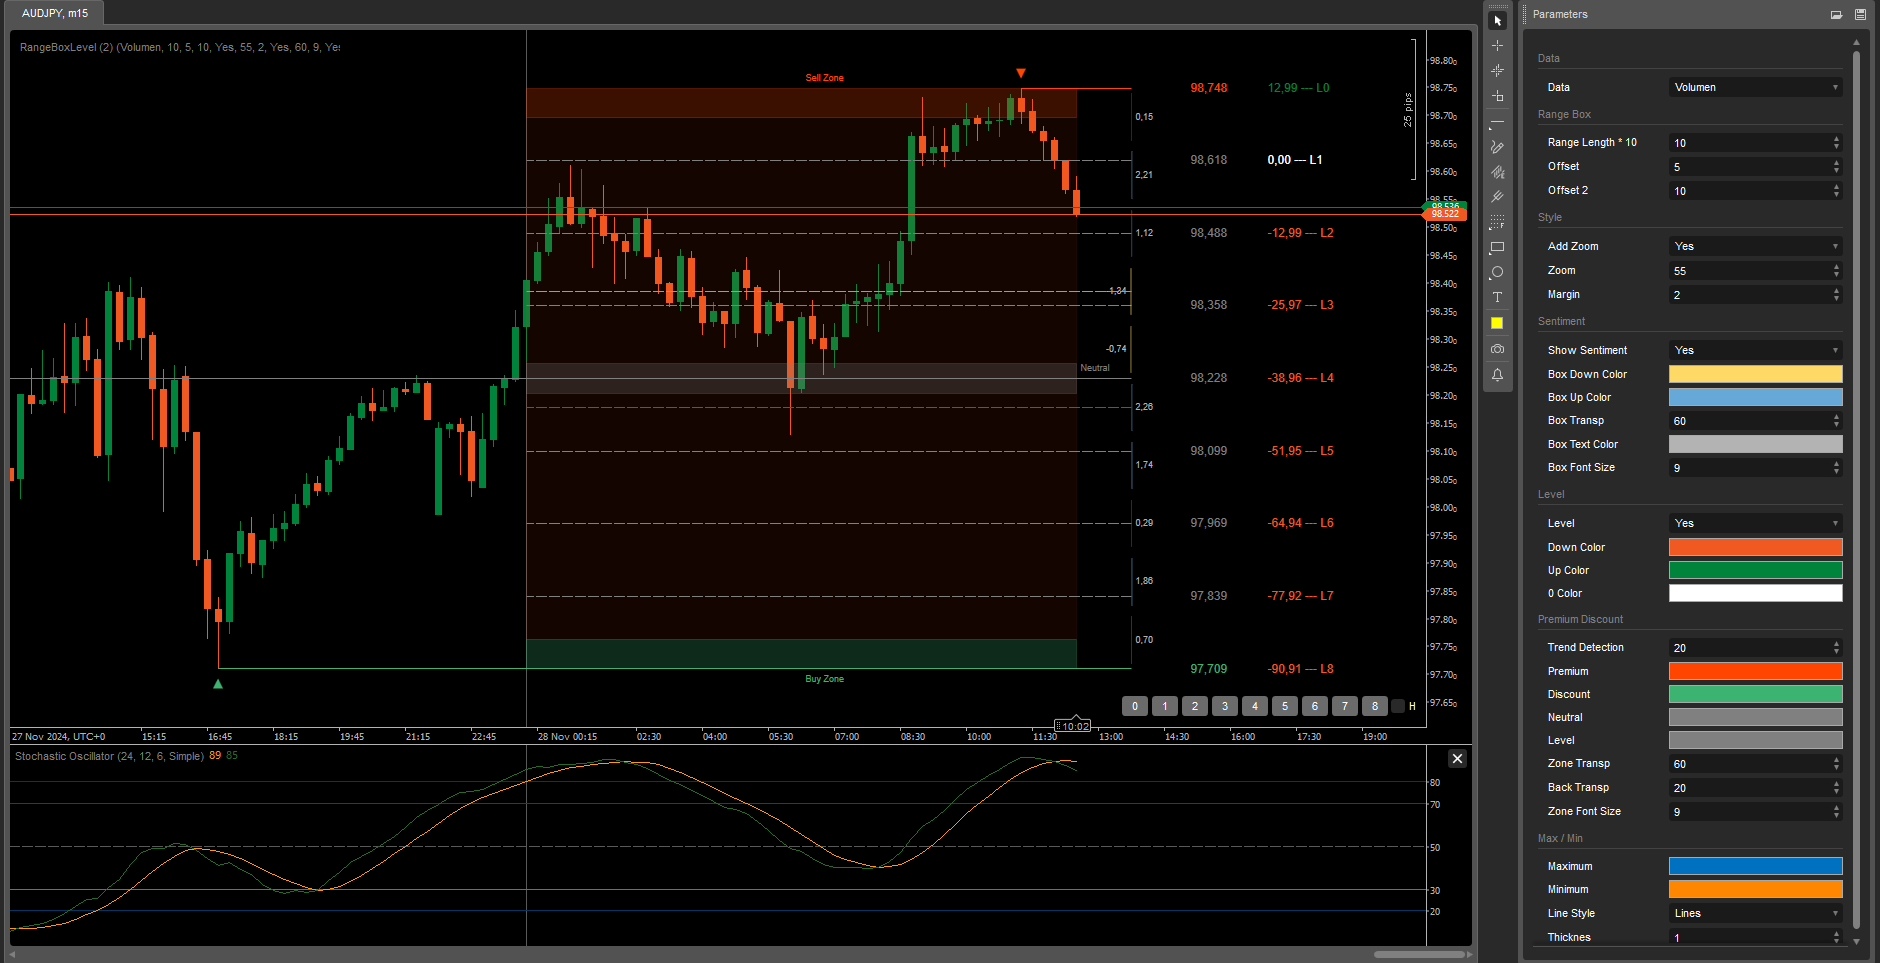
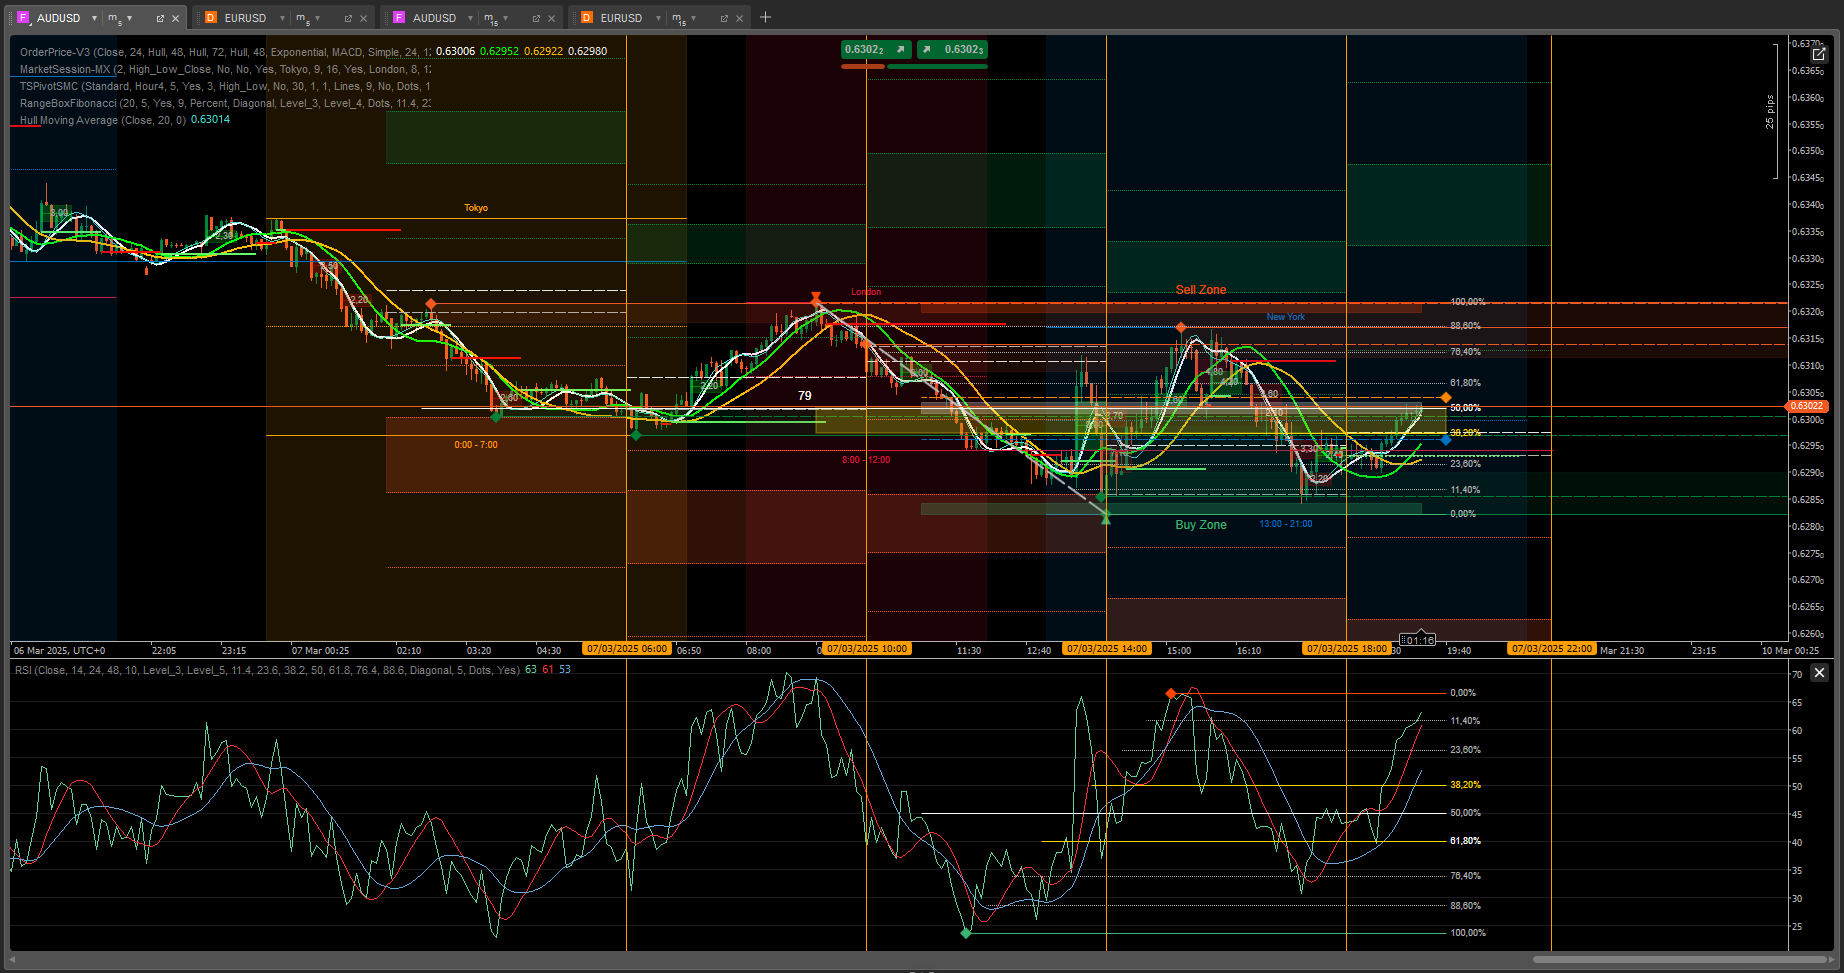
This technical analysis indicator provides information on market sentiment, trend and price levels. It uses data such as Volume, Open_Close, Chaikin Volatility and Chaikin Money Flow to calculate market sentiment. It also allows you to adjust spreads, detect trends and visualize price levels and pips. It is a useful tool to identify the prevailing force in the market, anticipate price movements and improve trading decision making.

In the description, I indicate the important parameters; the rest are style configurations such as color, line type, and font size.
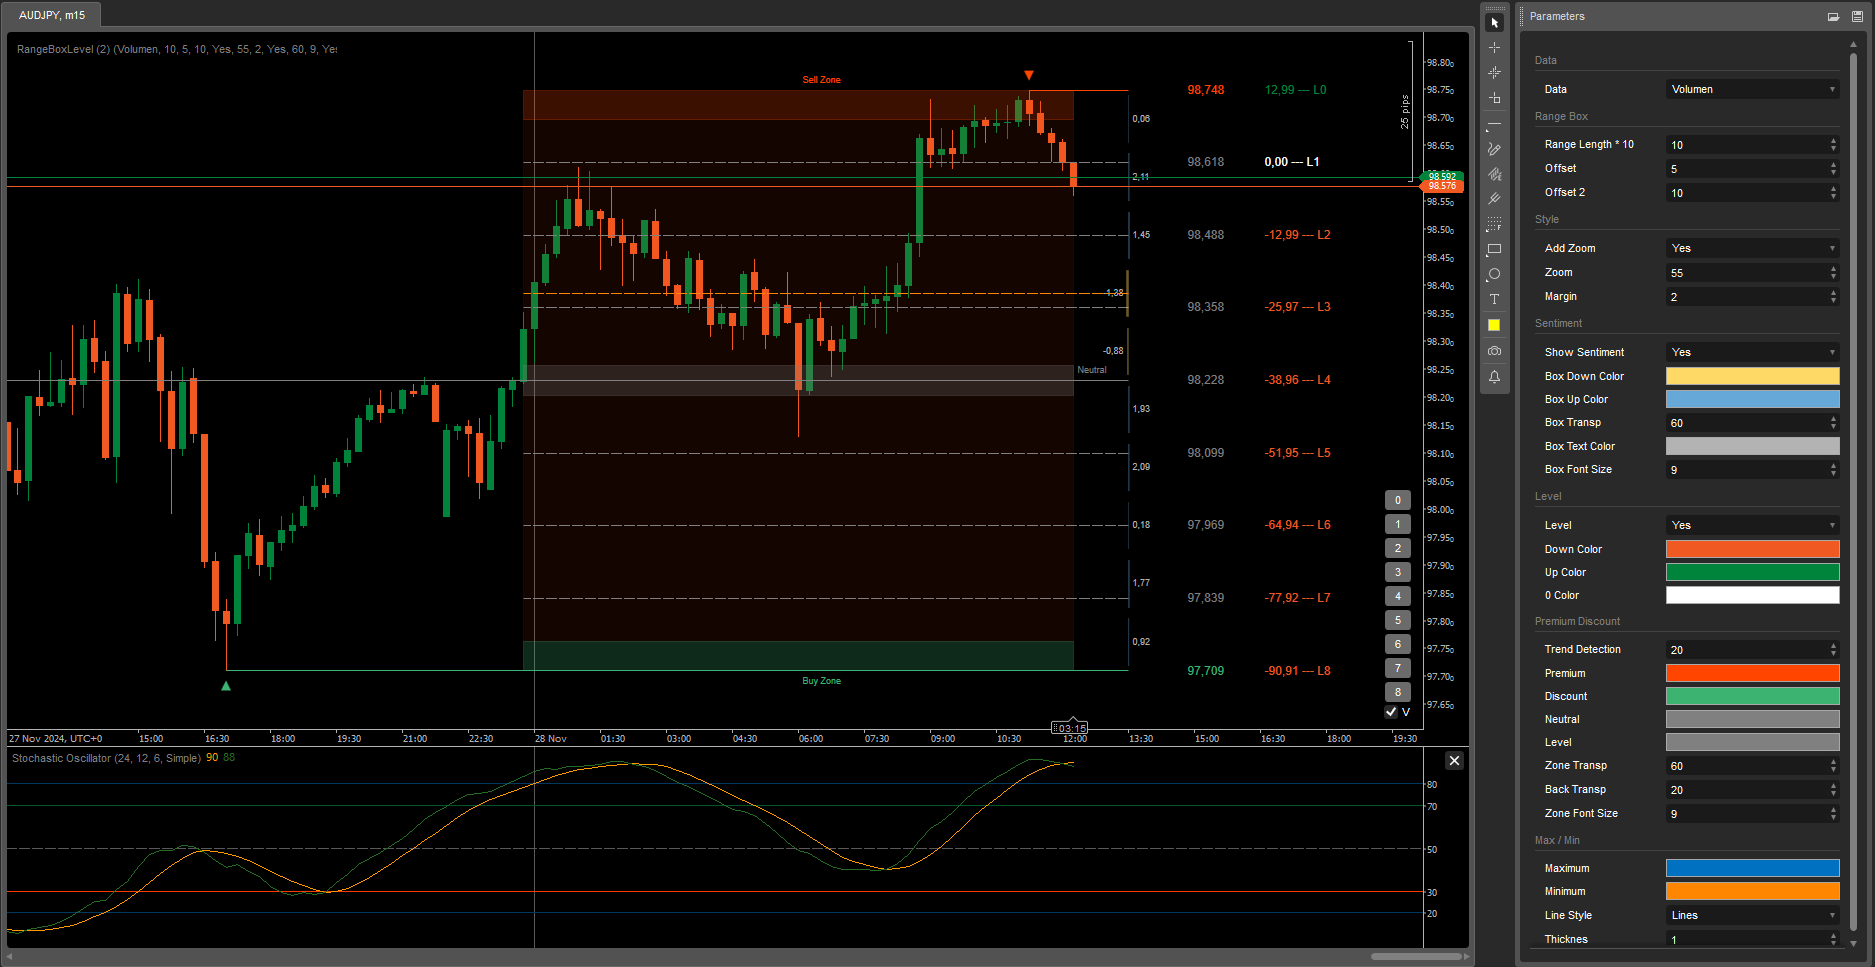
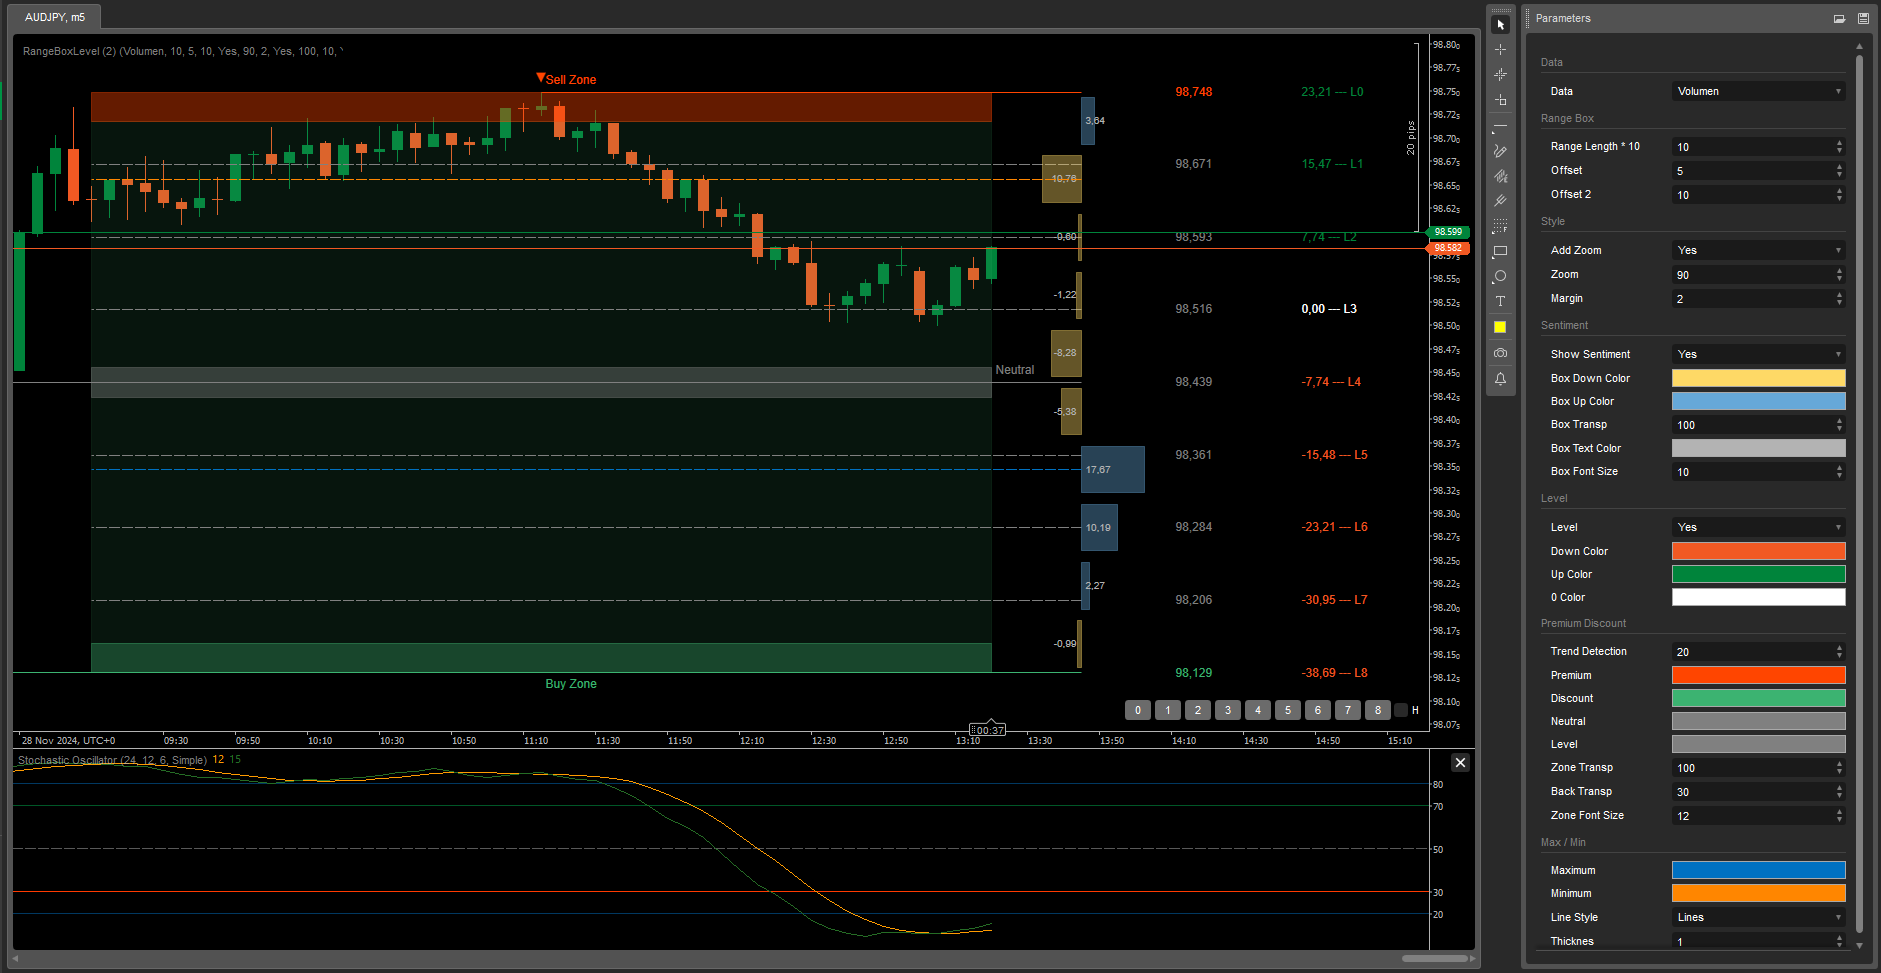
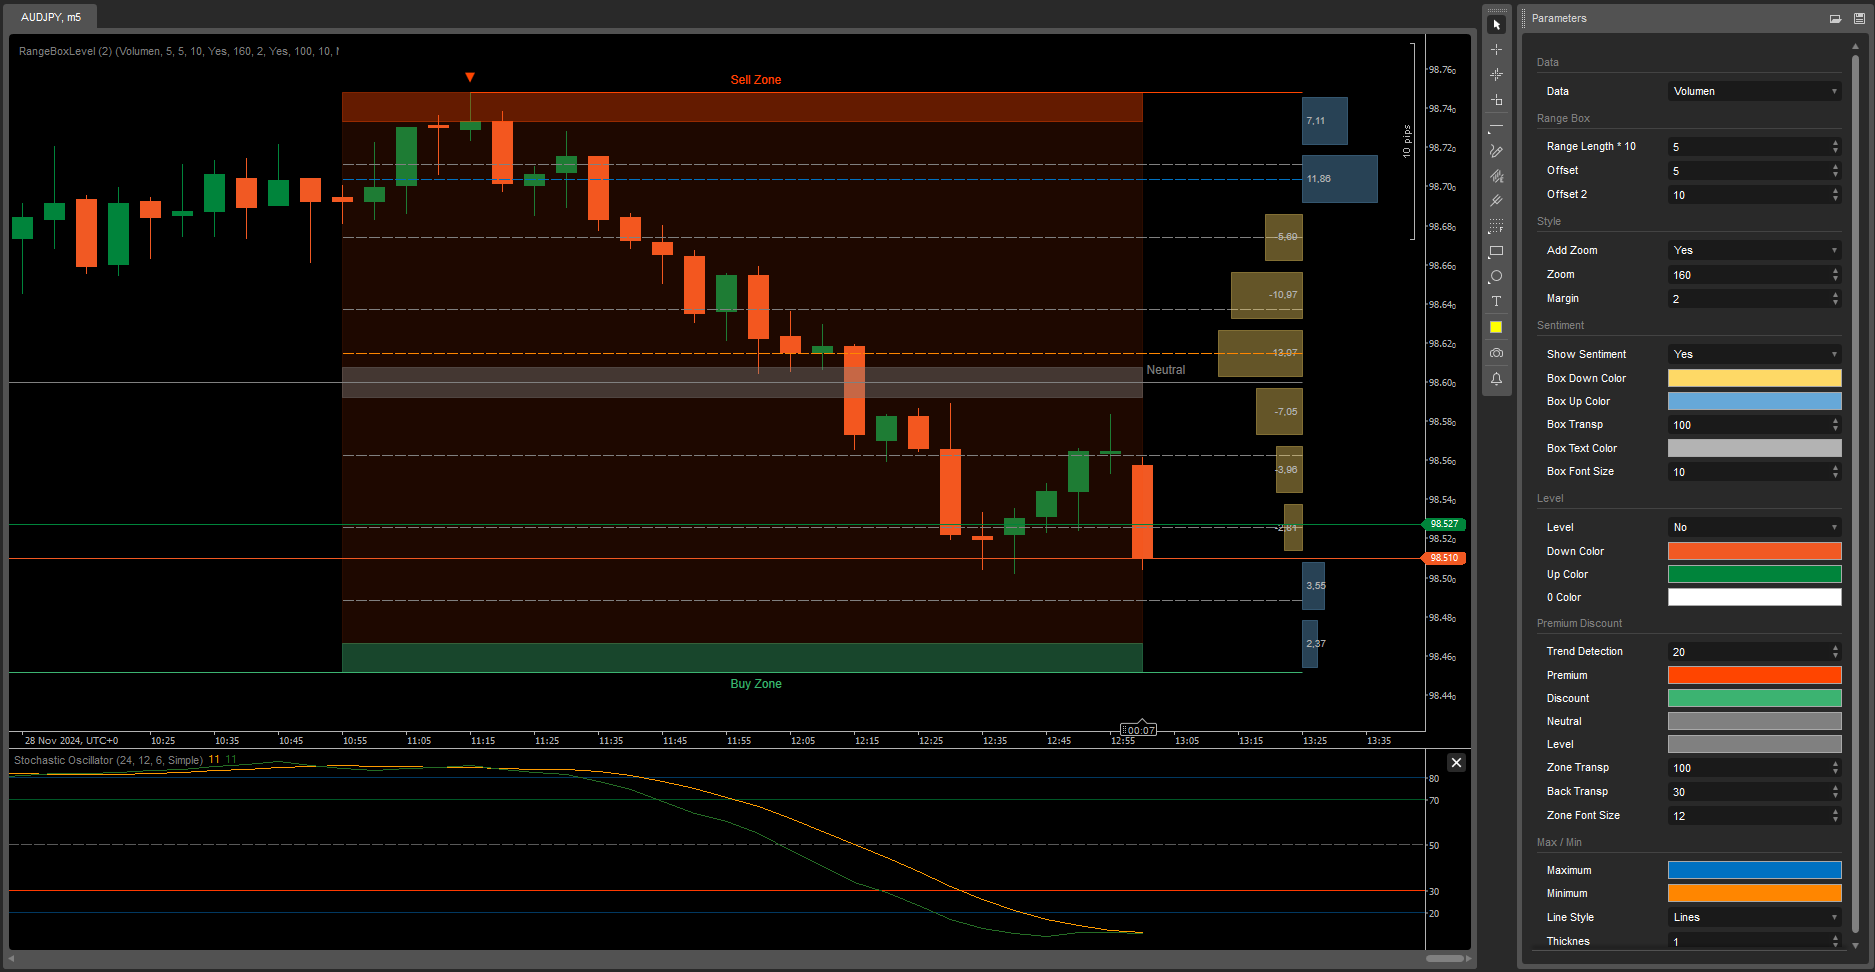
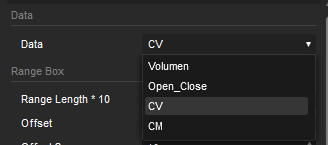


Data

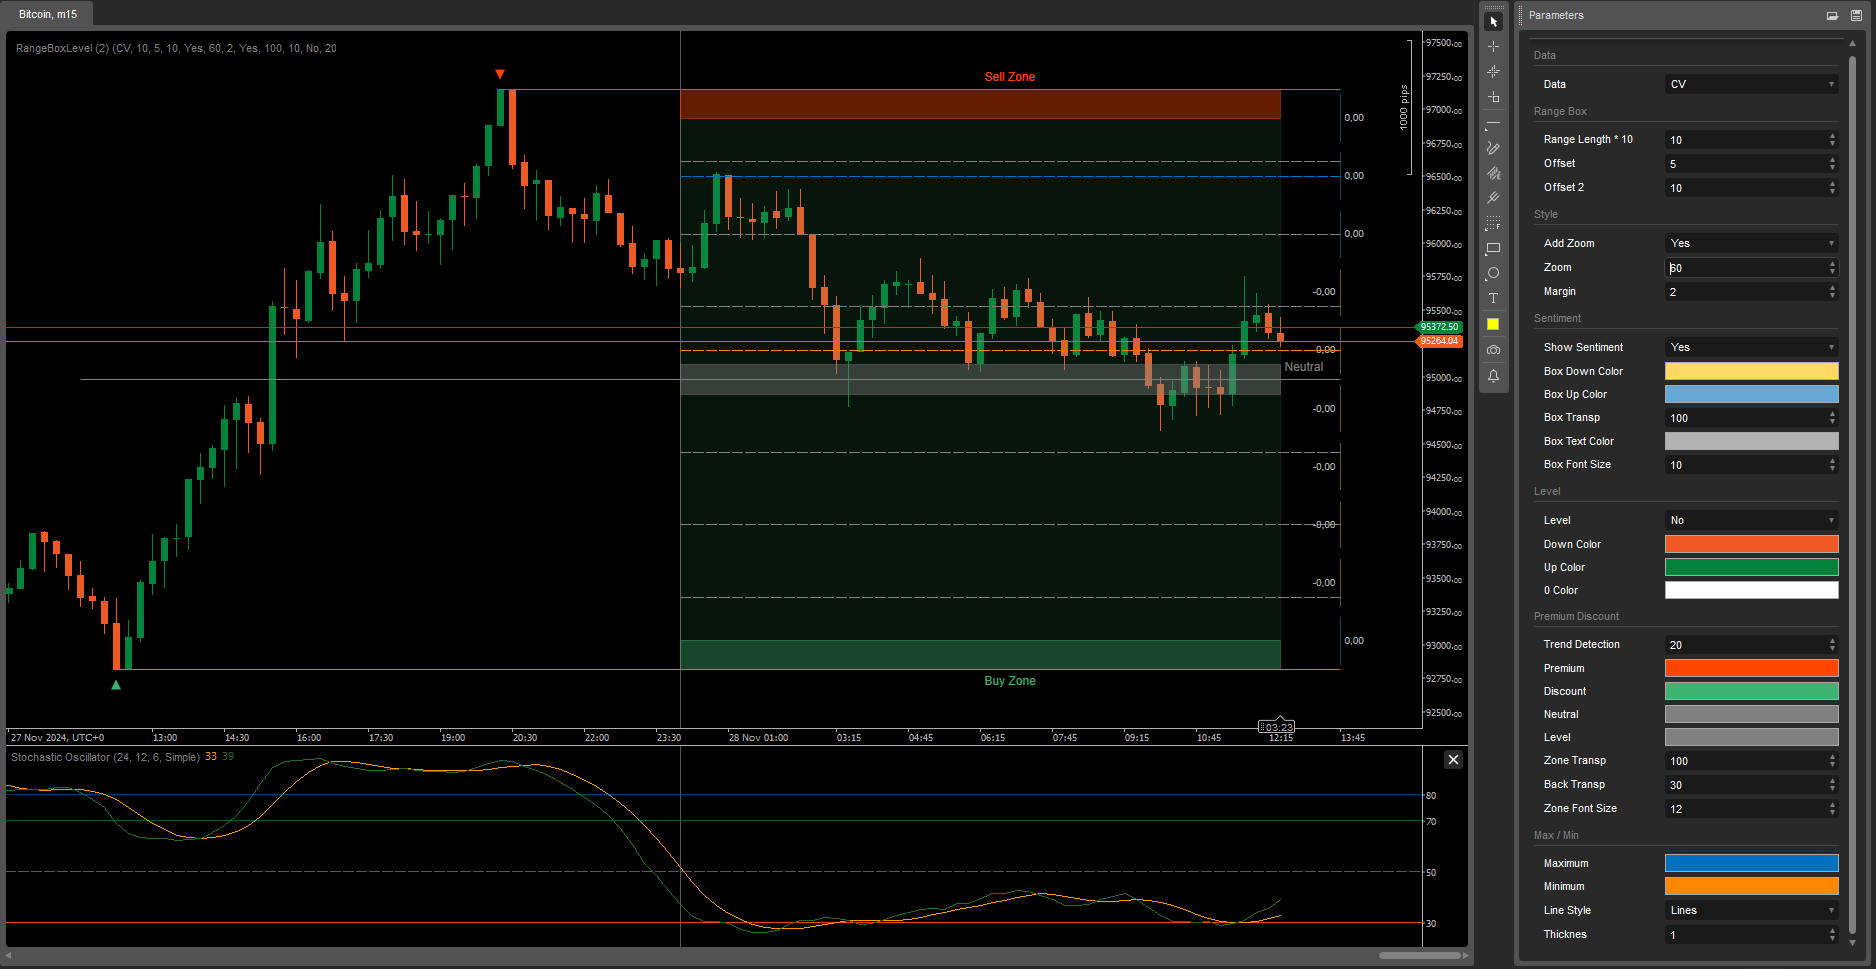
Sentiment calculations are based on selecting from Volume, Open_Close, Chaikin Volatility, and Chaikin Money Flow.
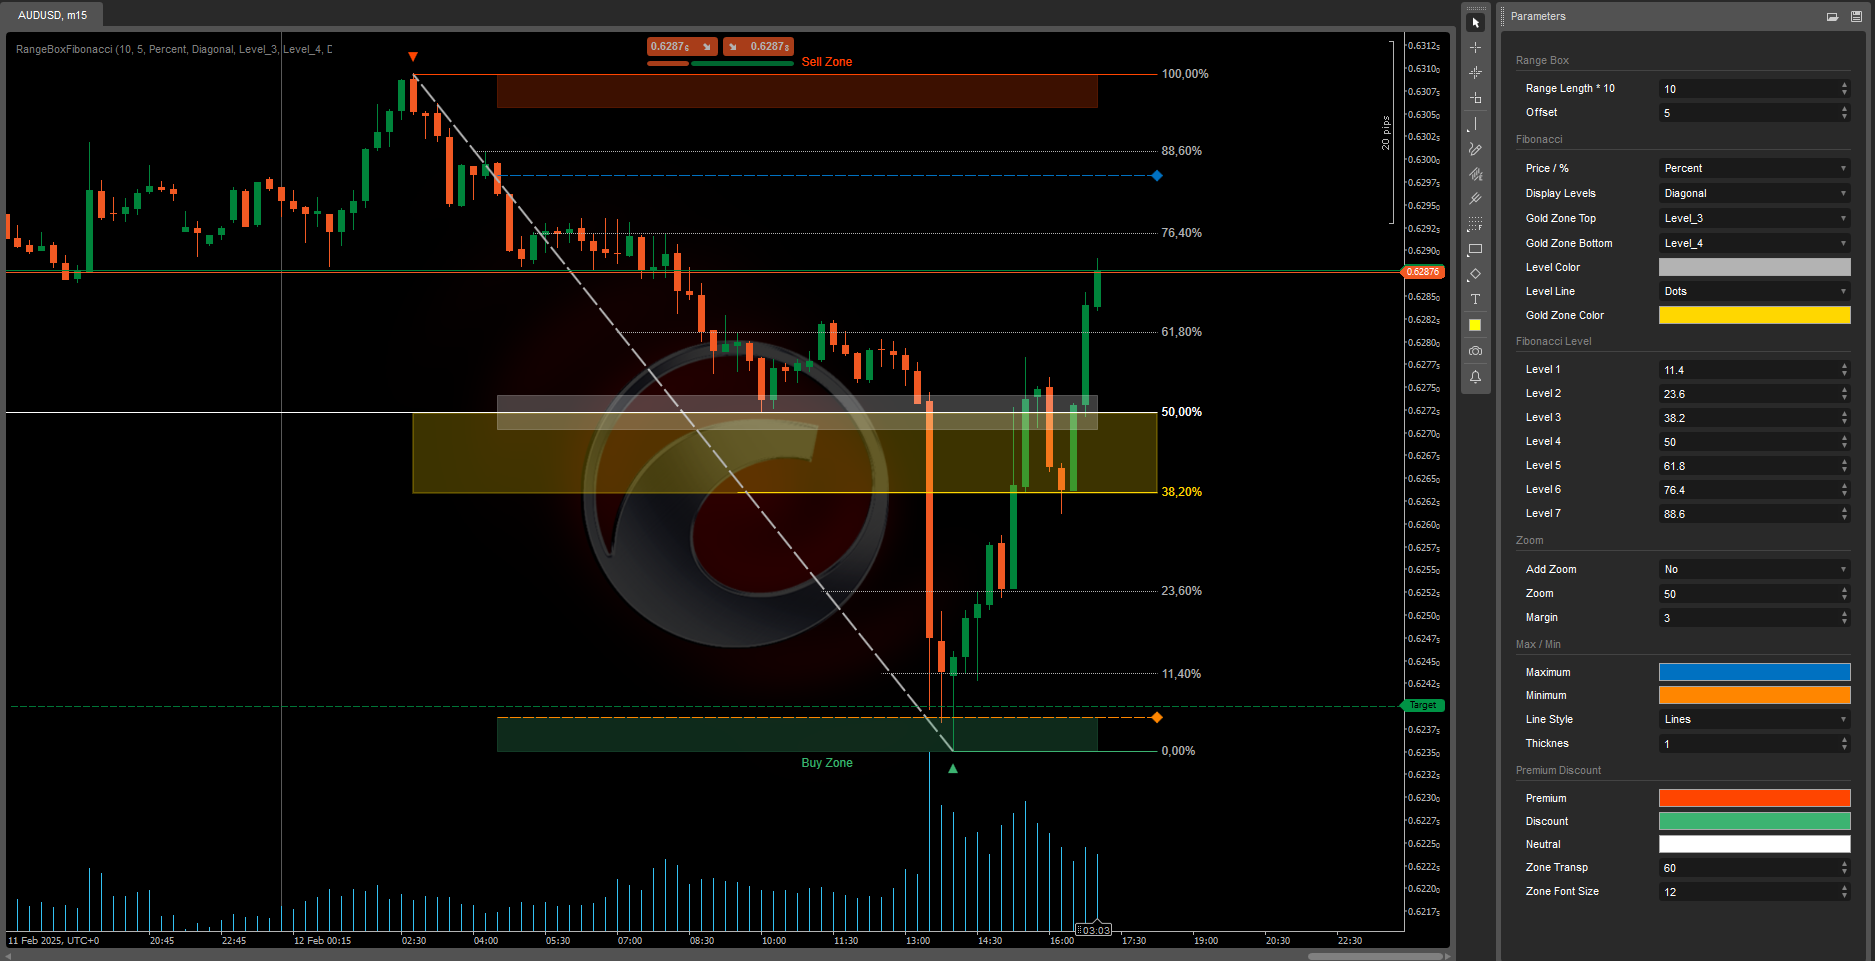
Range Length * 10

The value indicates the number of candles (periods) the calculation is based on – the value is multiplied by 10.

Add Zoom

To keep the chart centered, this also helps to consider situations like consolidation and trend changes.

Margin

Allows adjusting the top and bottom margins to improve visualization.
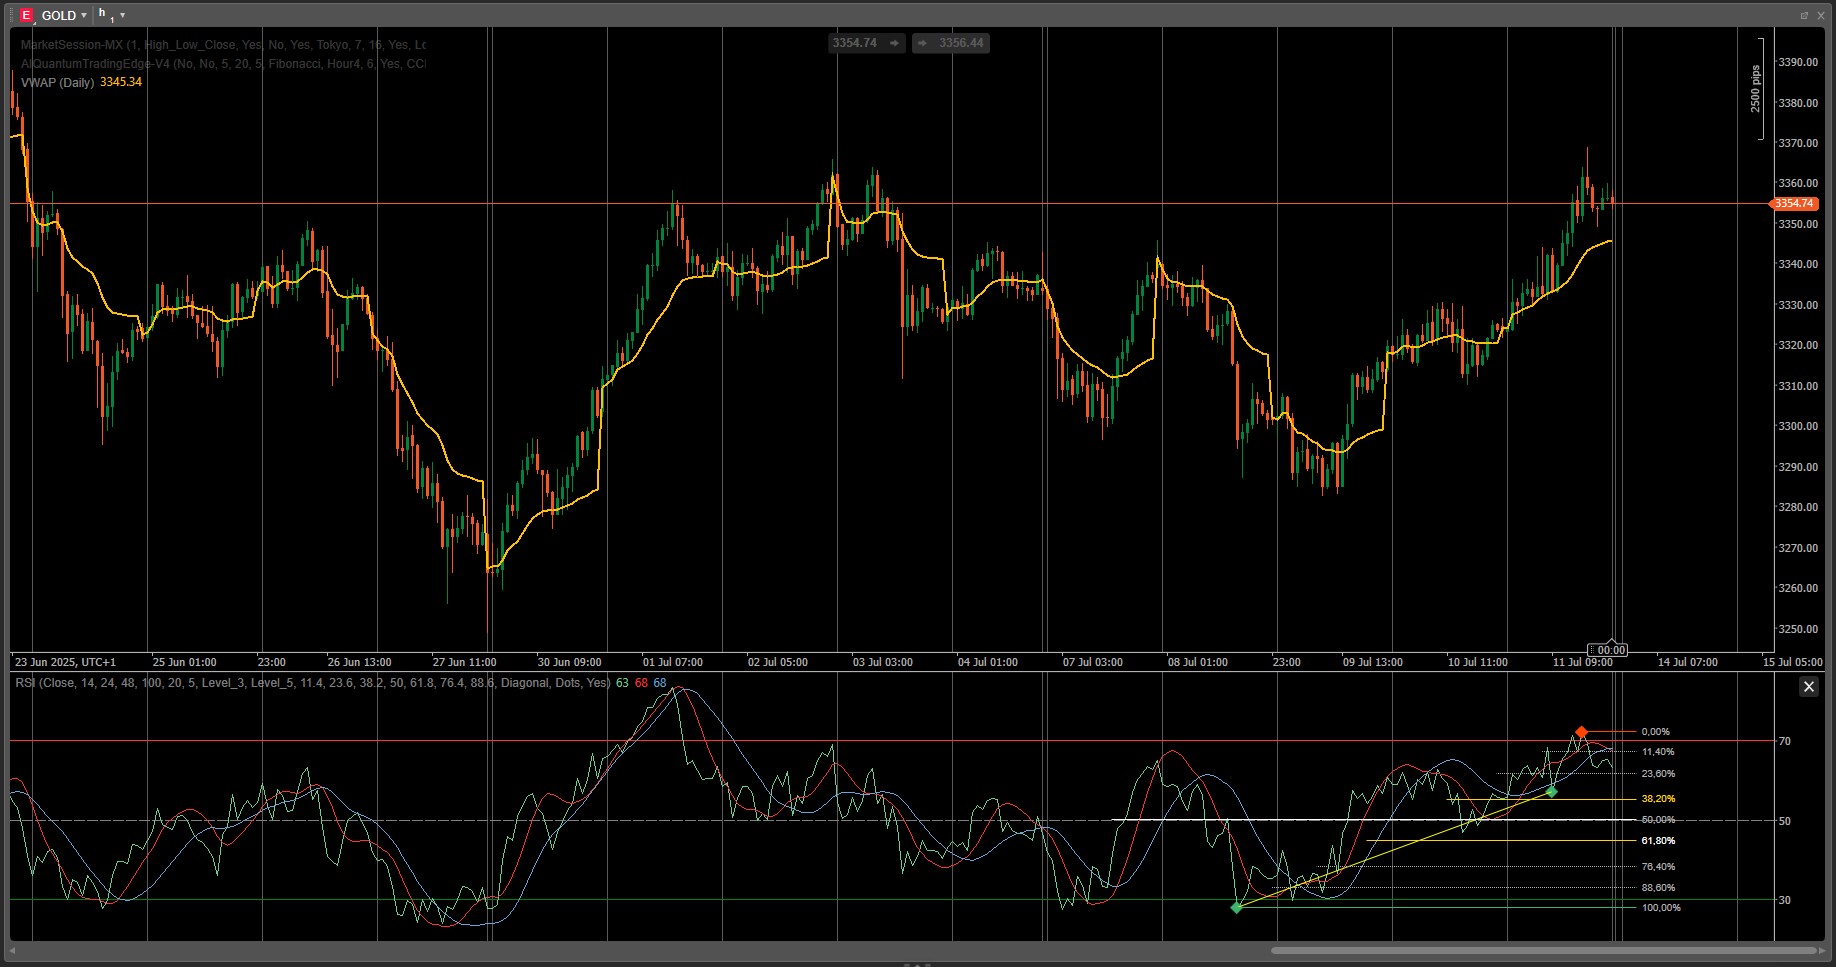
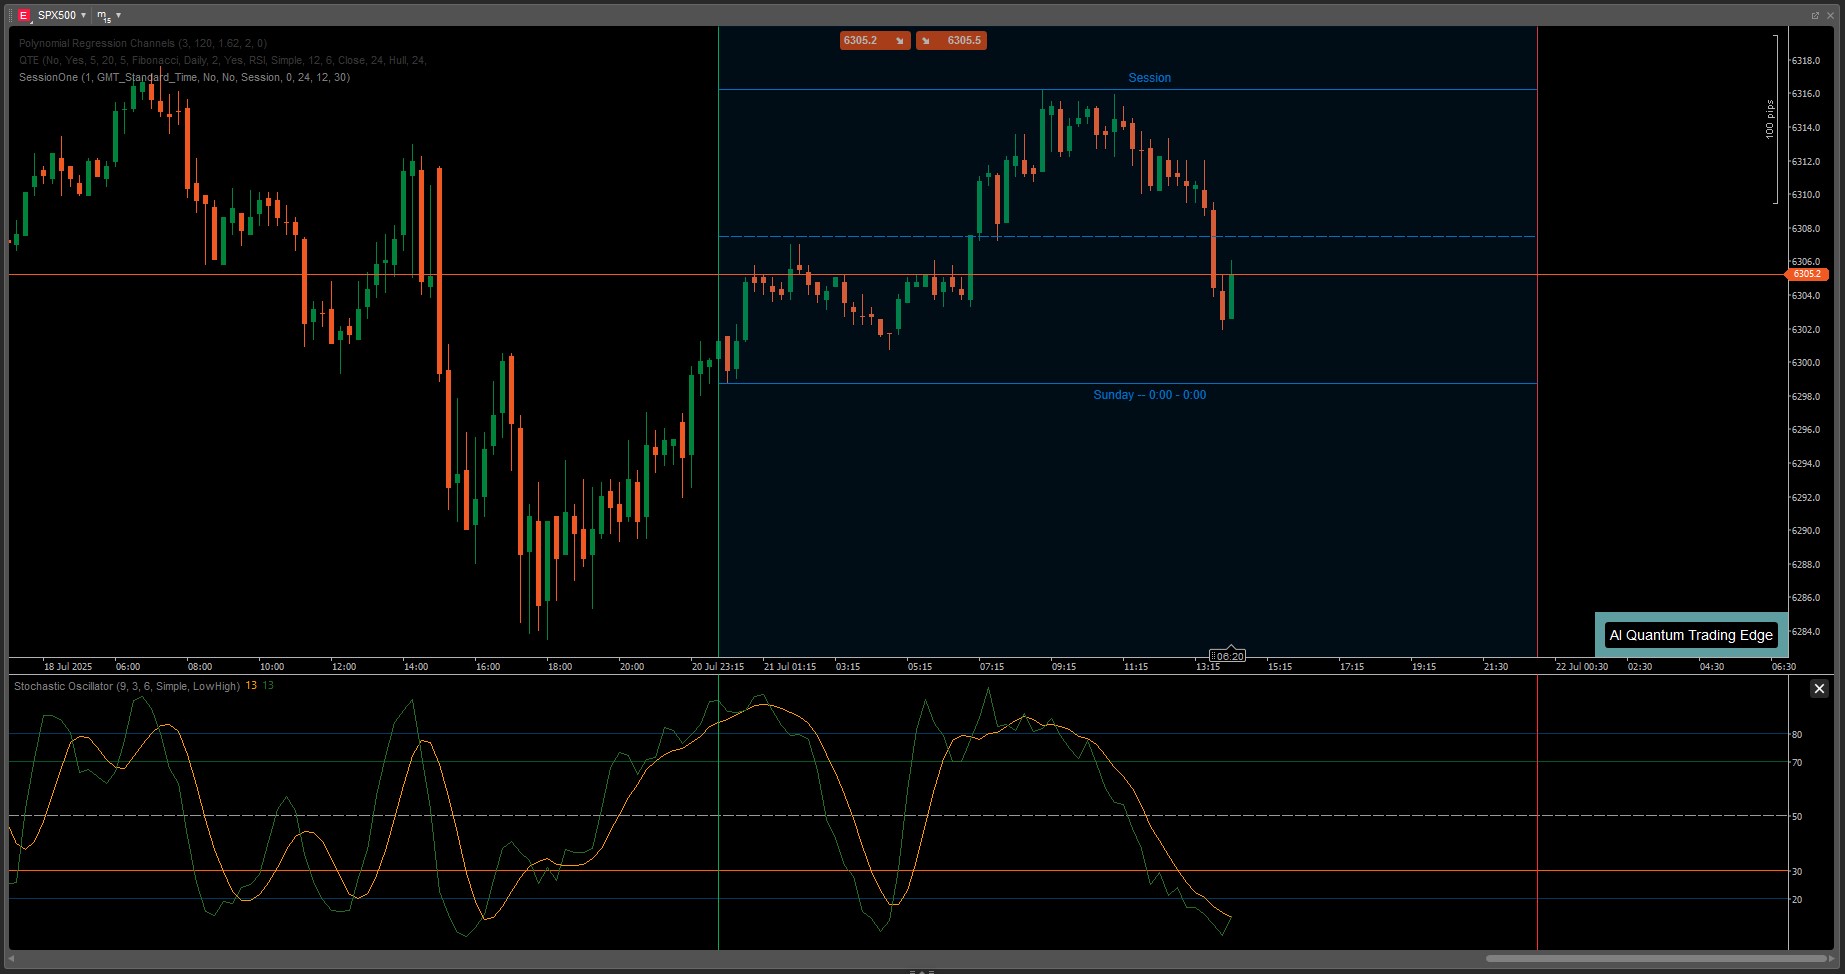
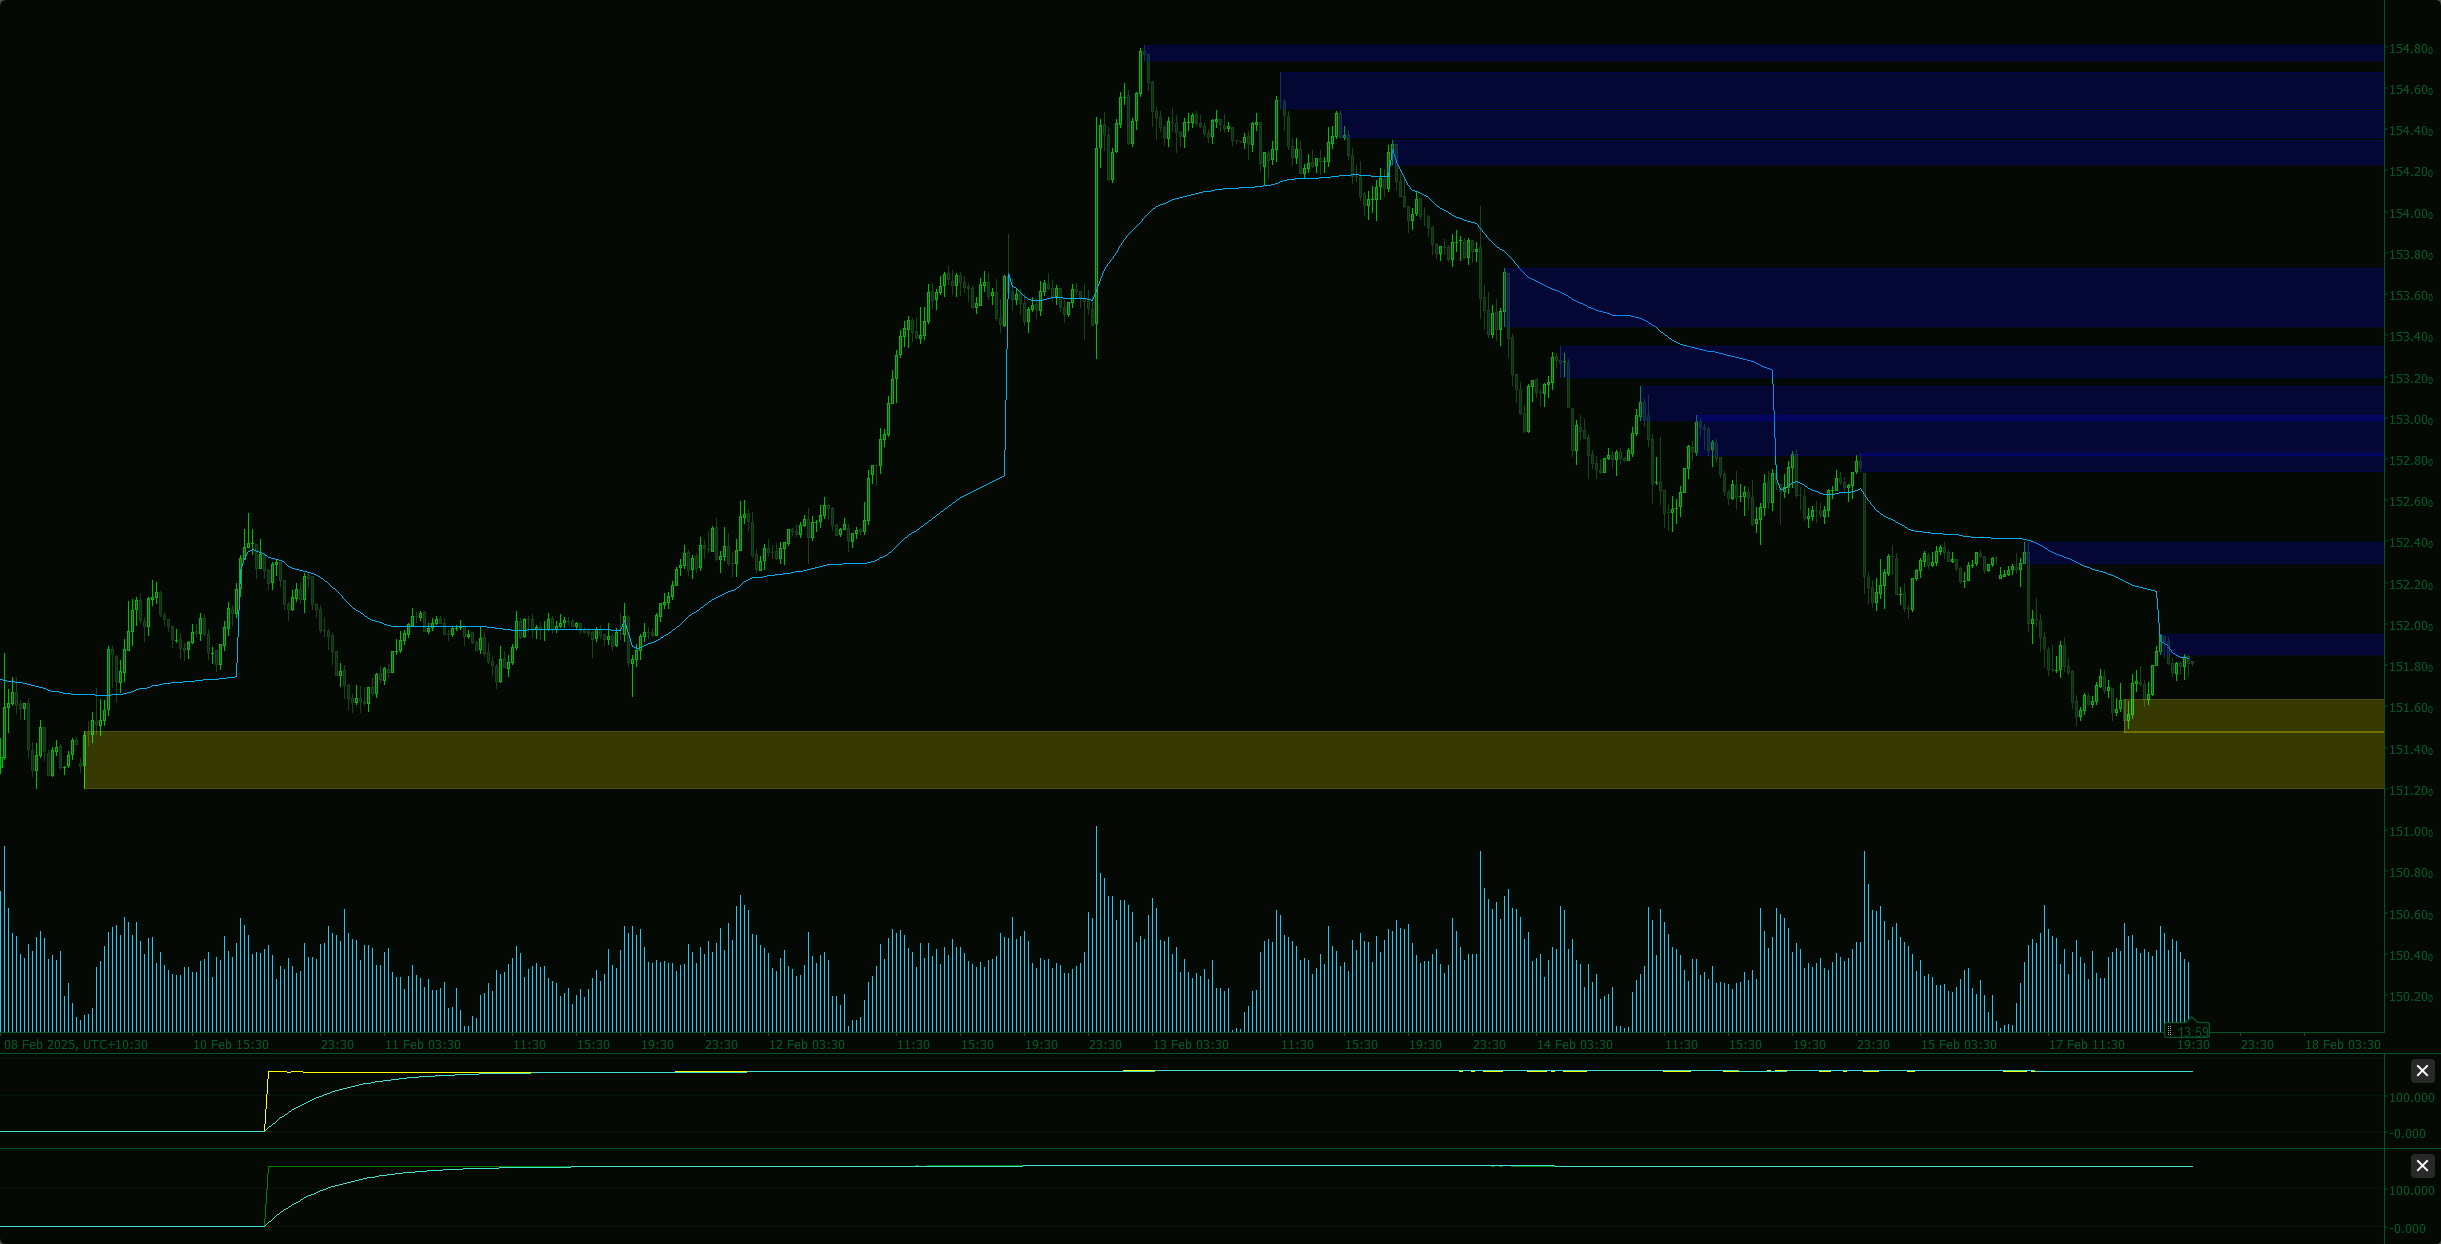
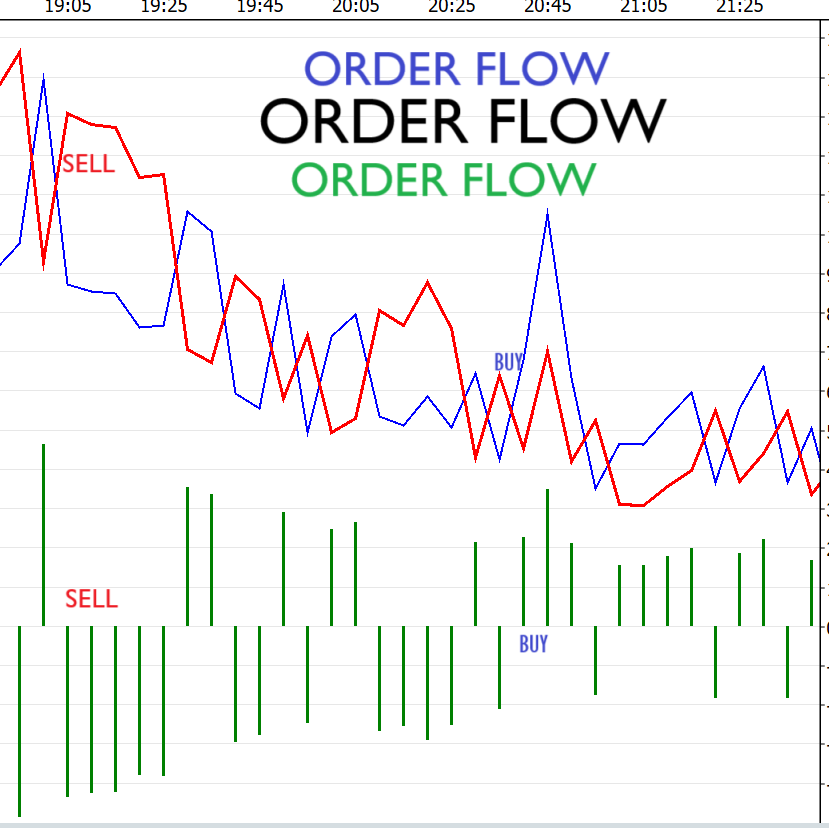
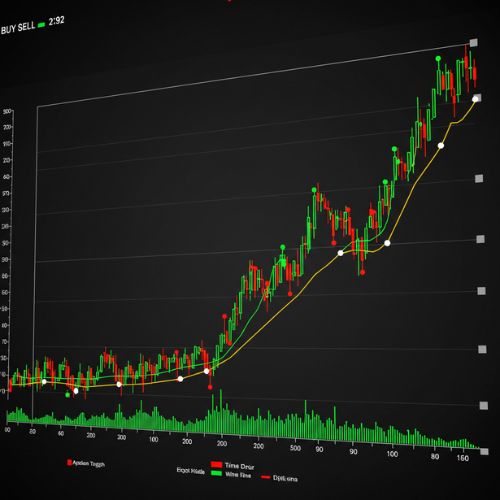
Show Sentiment

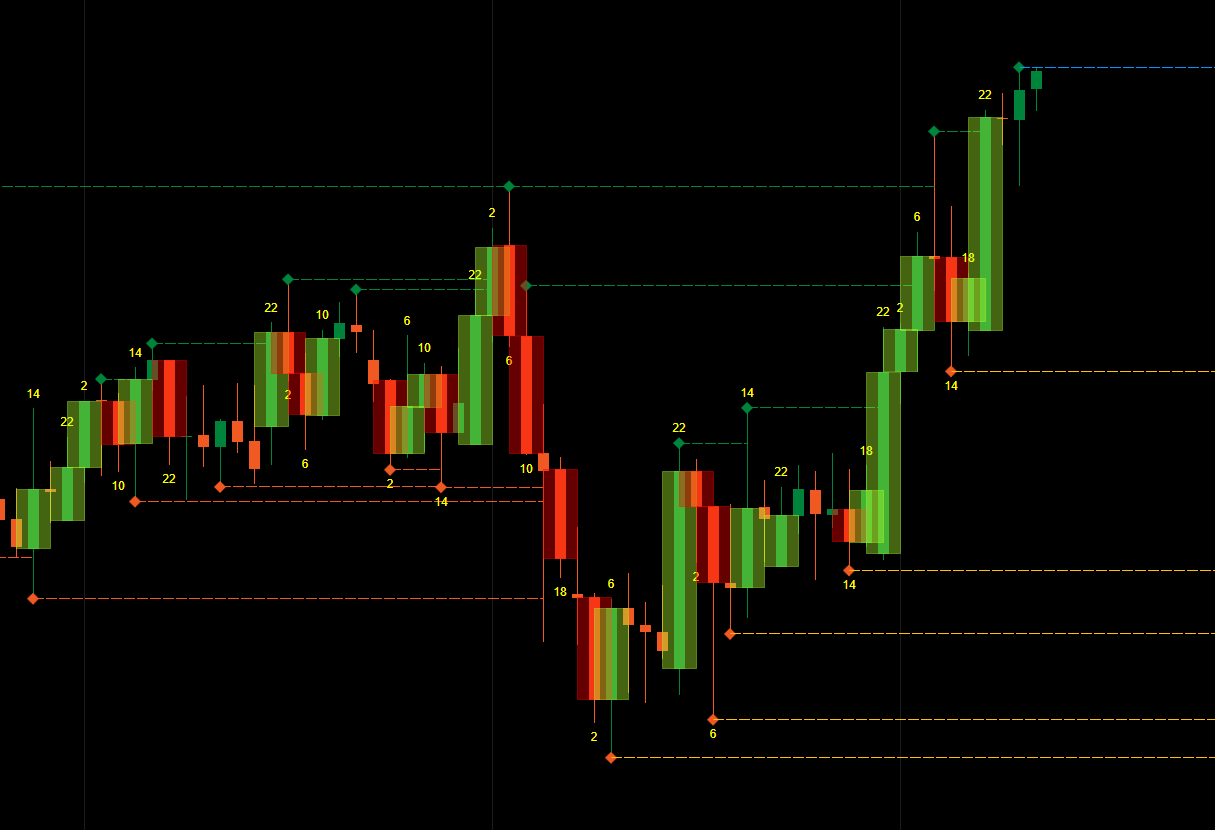
Sentiment indicates which force is stronger in the market at the moment. If the yellow bars increase in size, it means there are more sellers, and vice versa. If you do not wish to see the sentiment visualization, you can hide it on the right side.
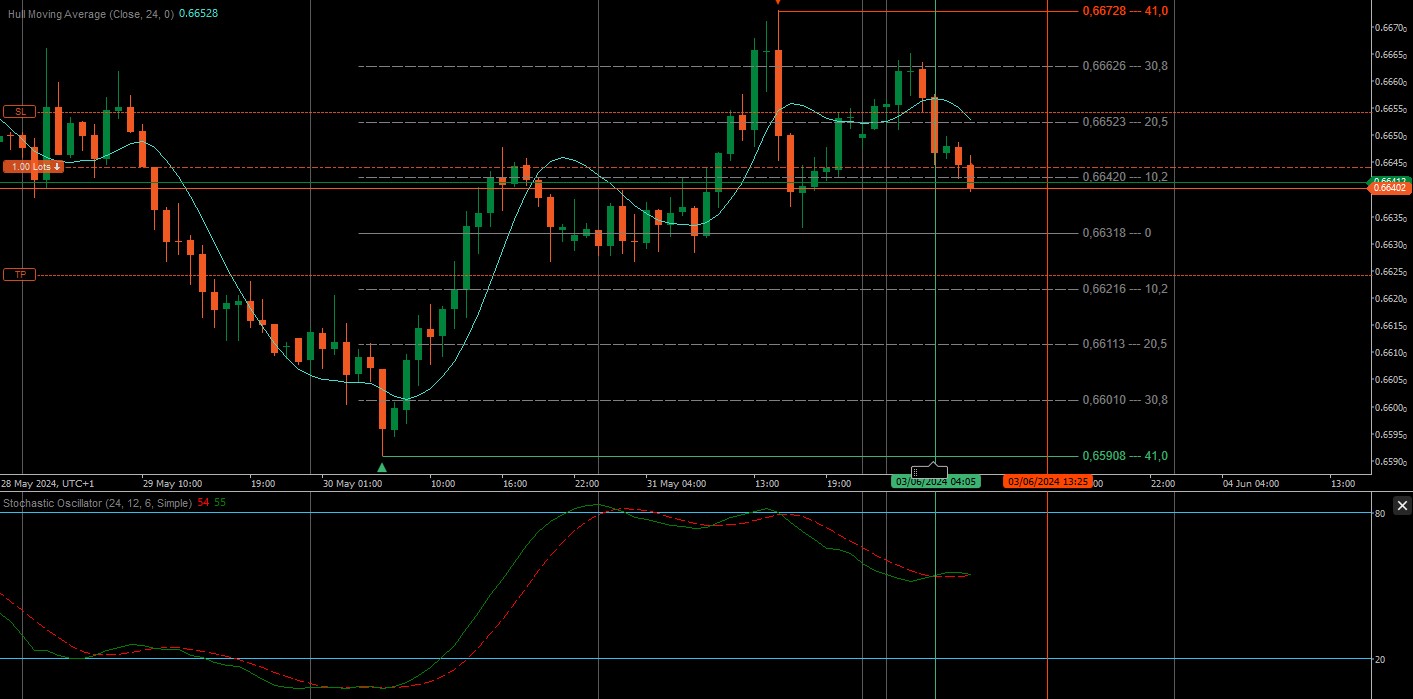
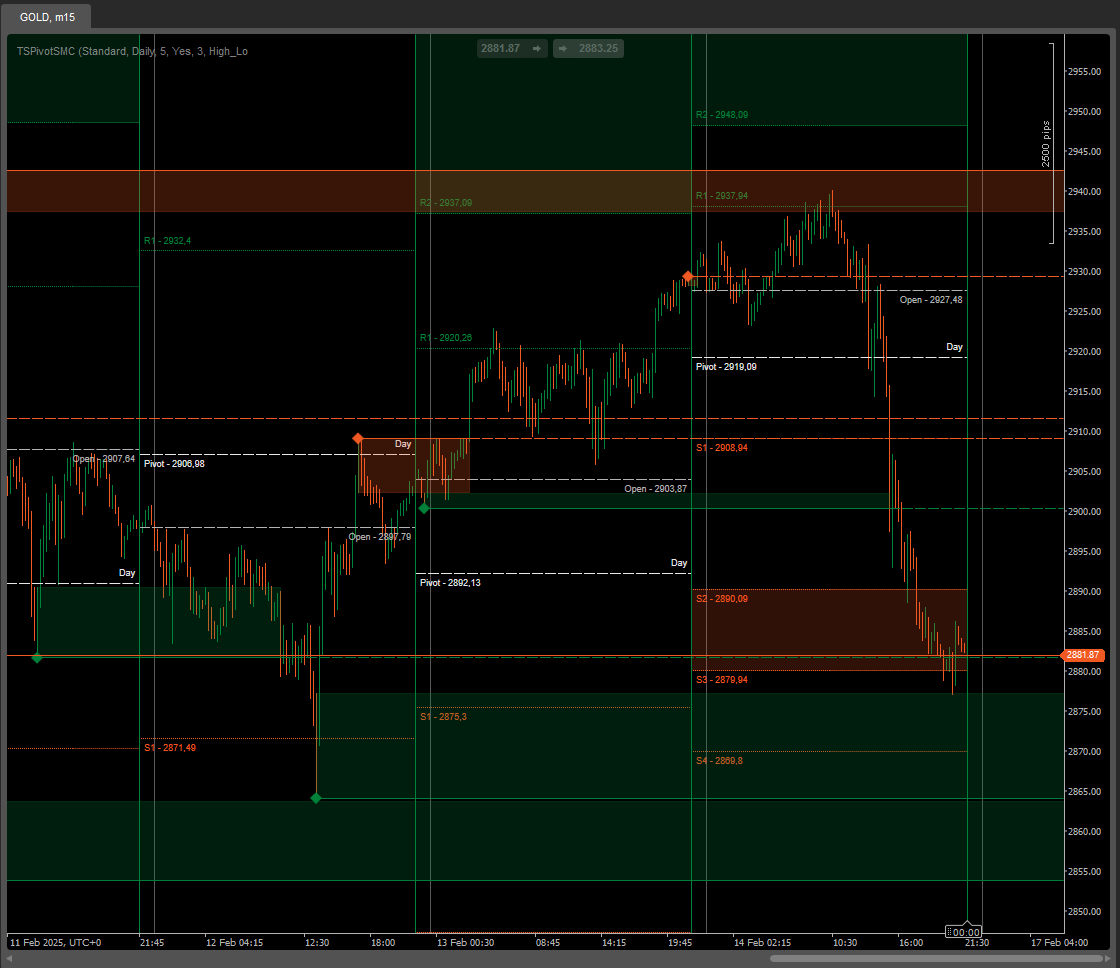
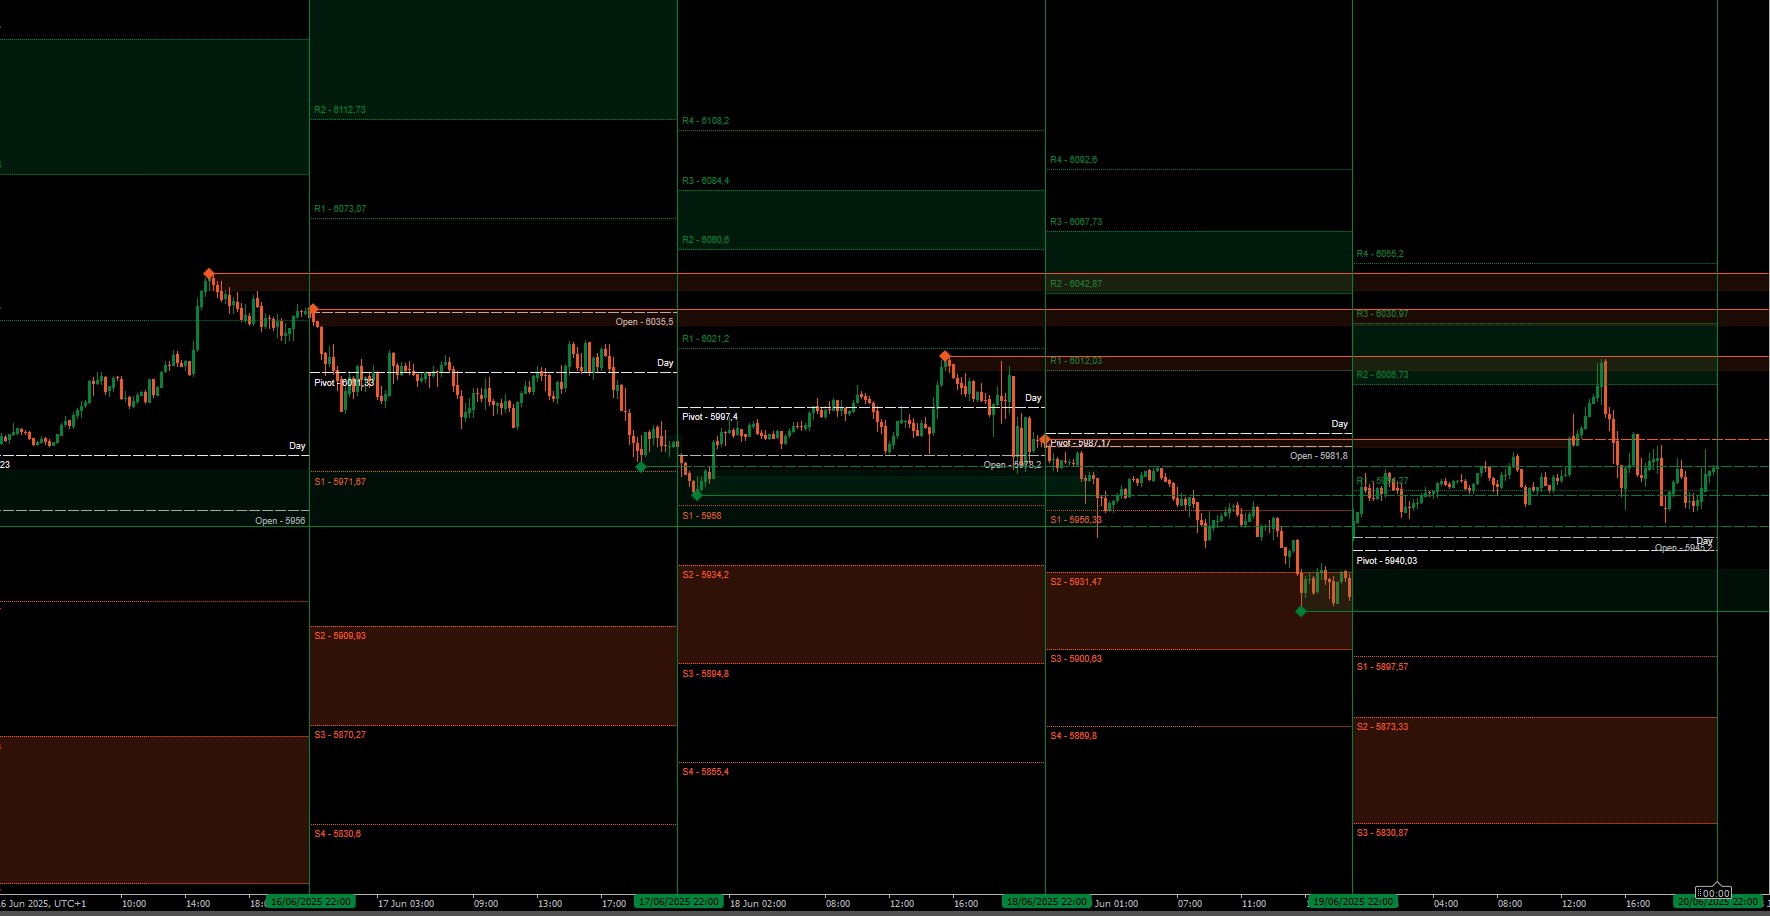
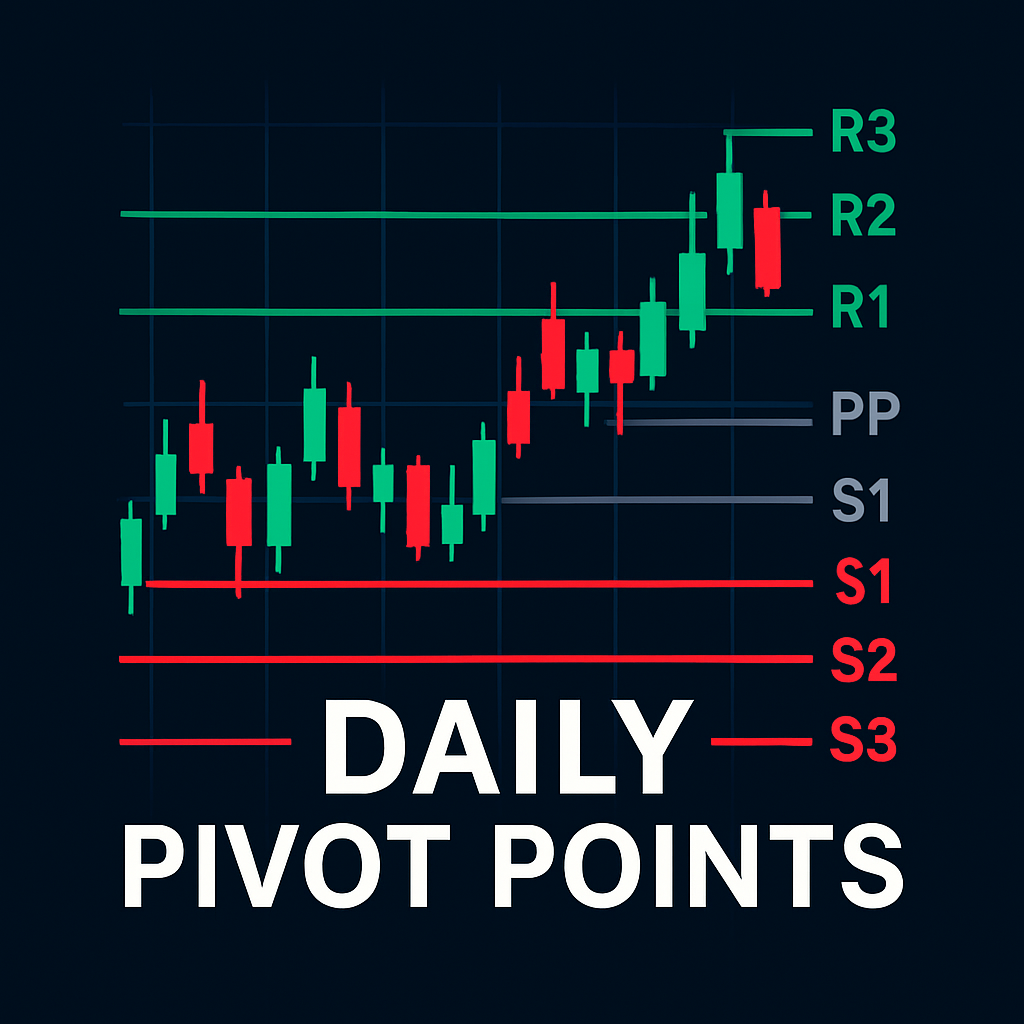
Level

This is an extra feature that can be used as a reference for prices and pips at each level. When you select a level where you want to place the buy order, it indicates the pips at each level that the price can reach.
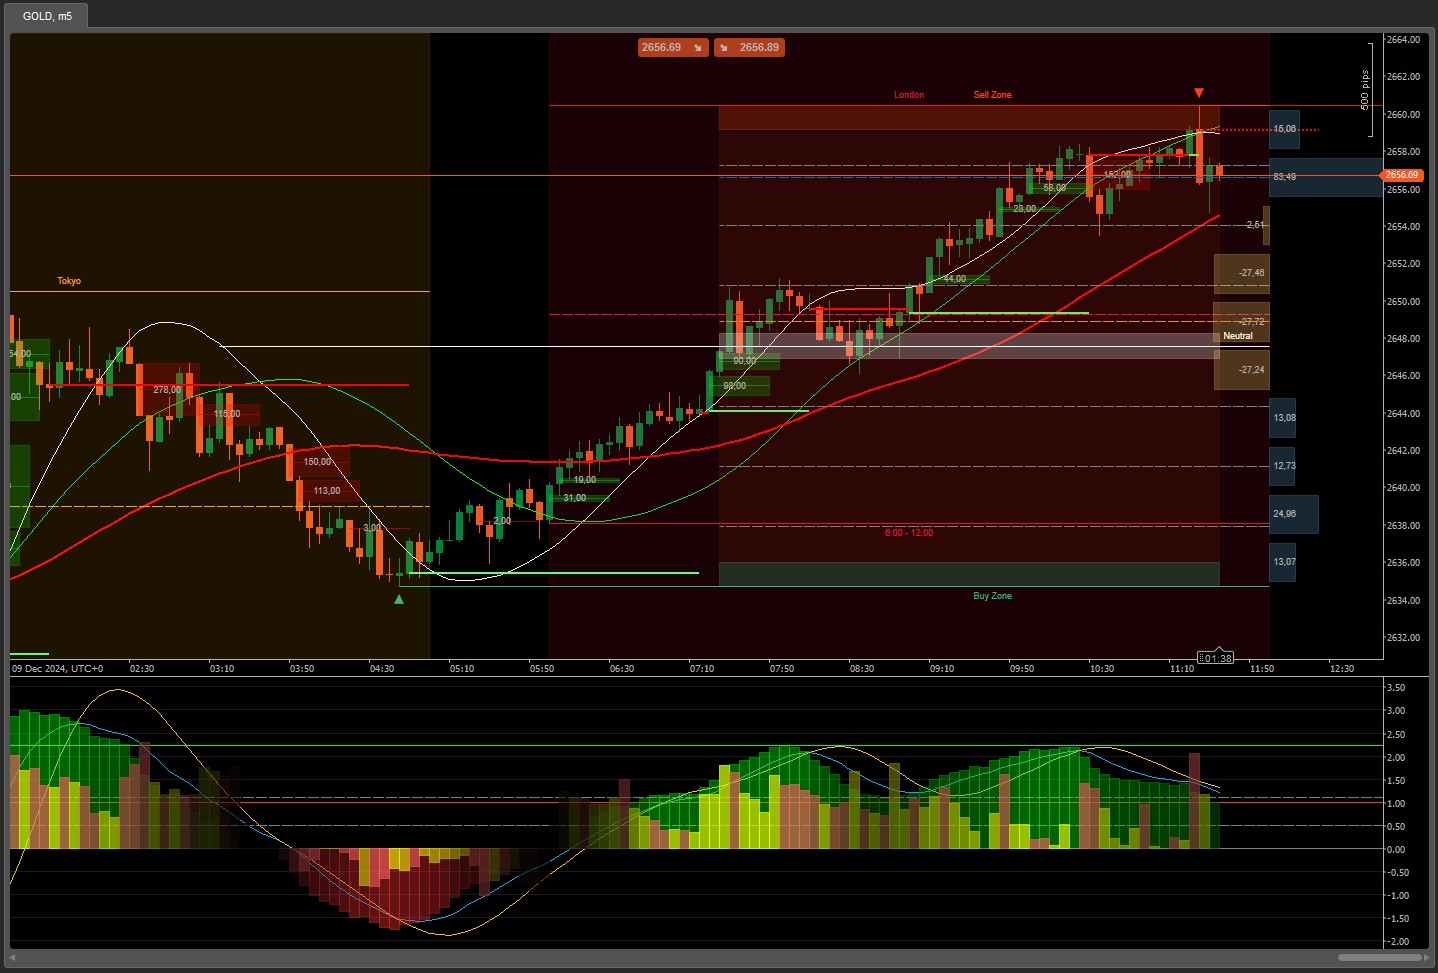
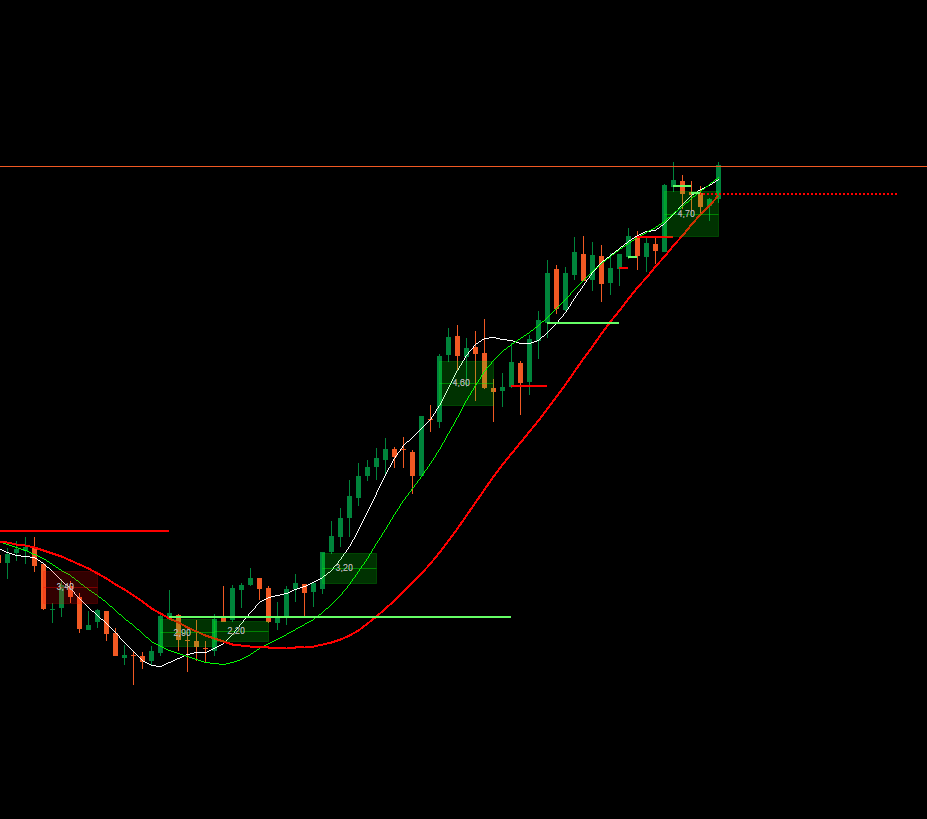
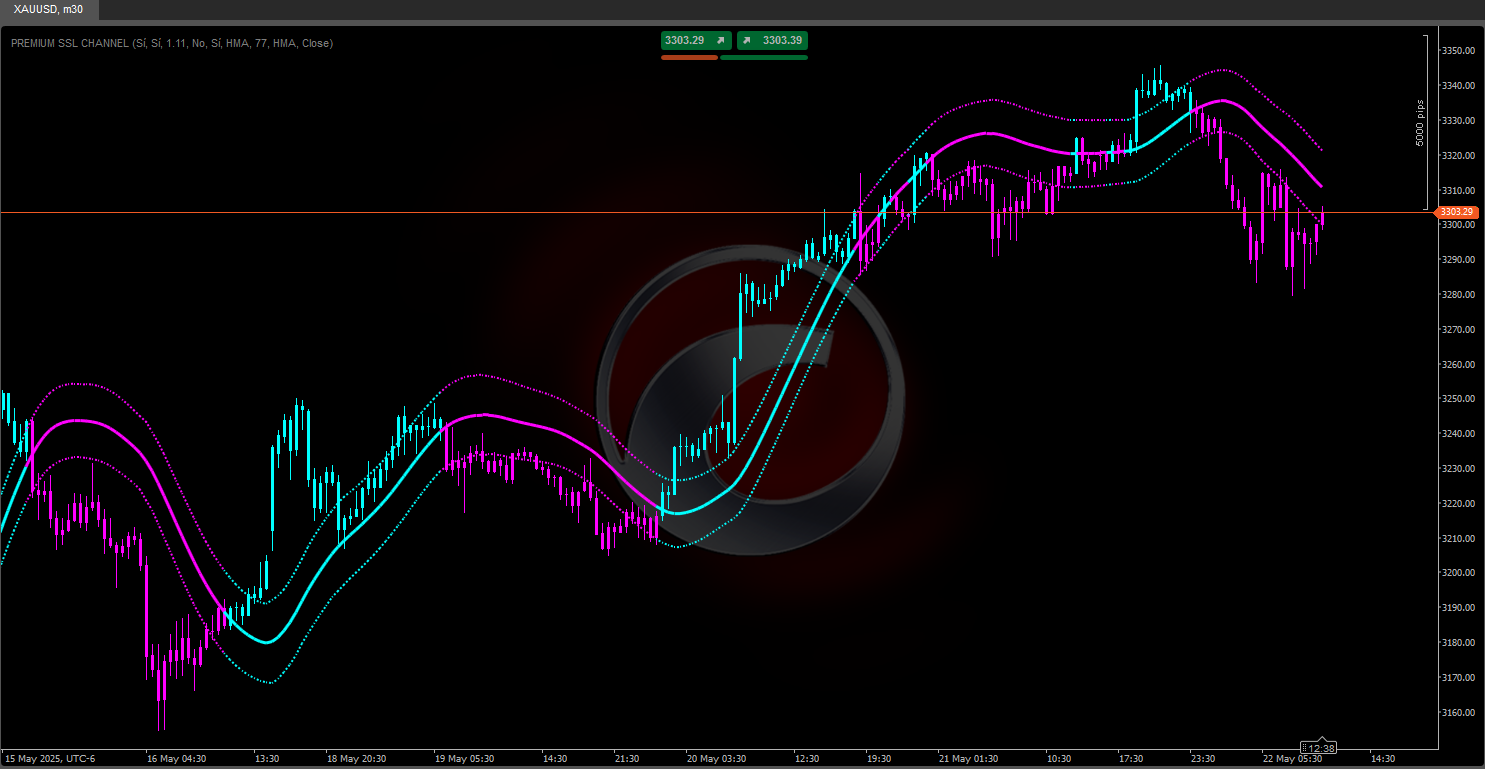
Trend Detection

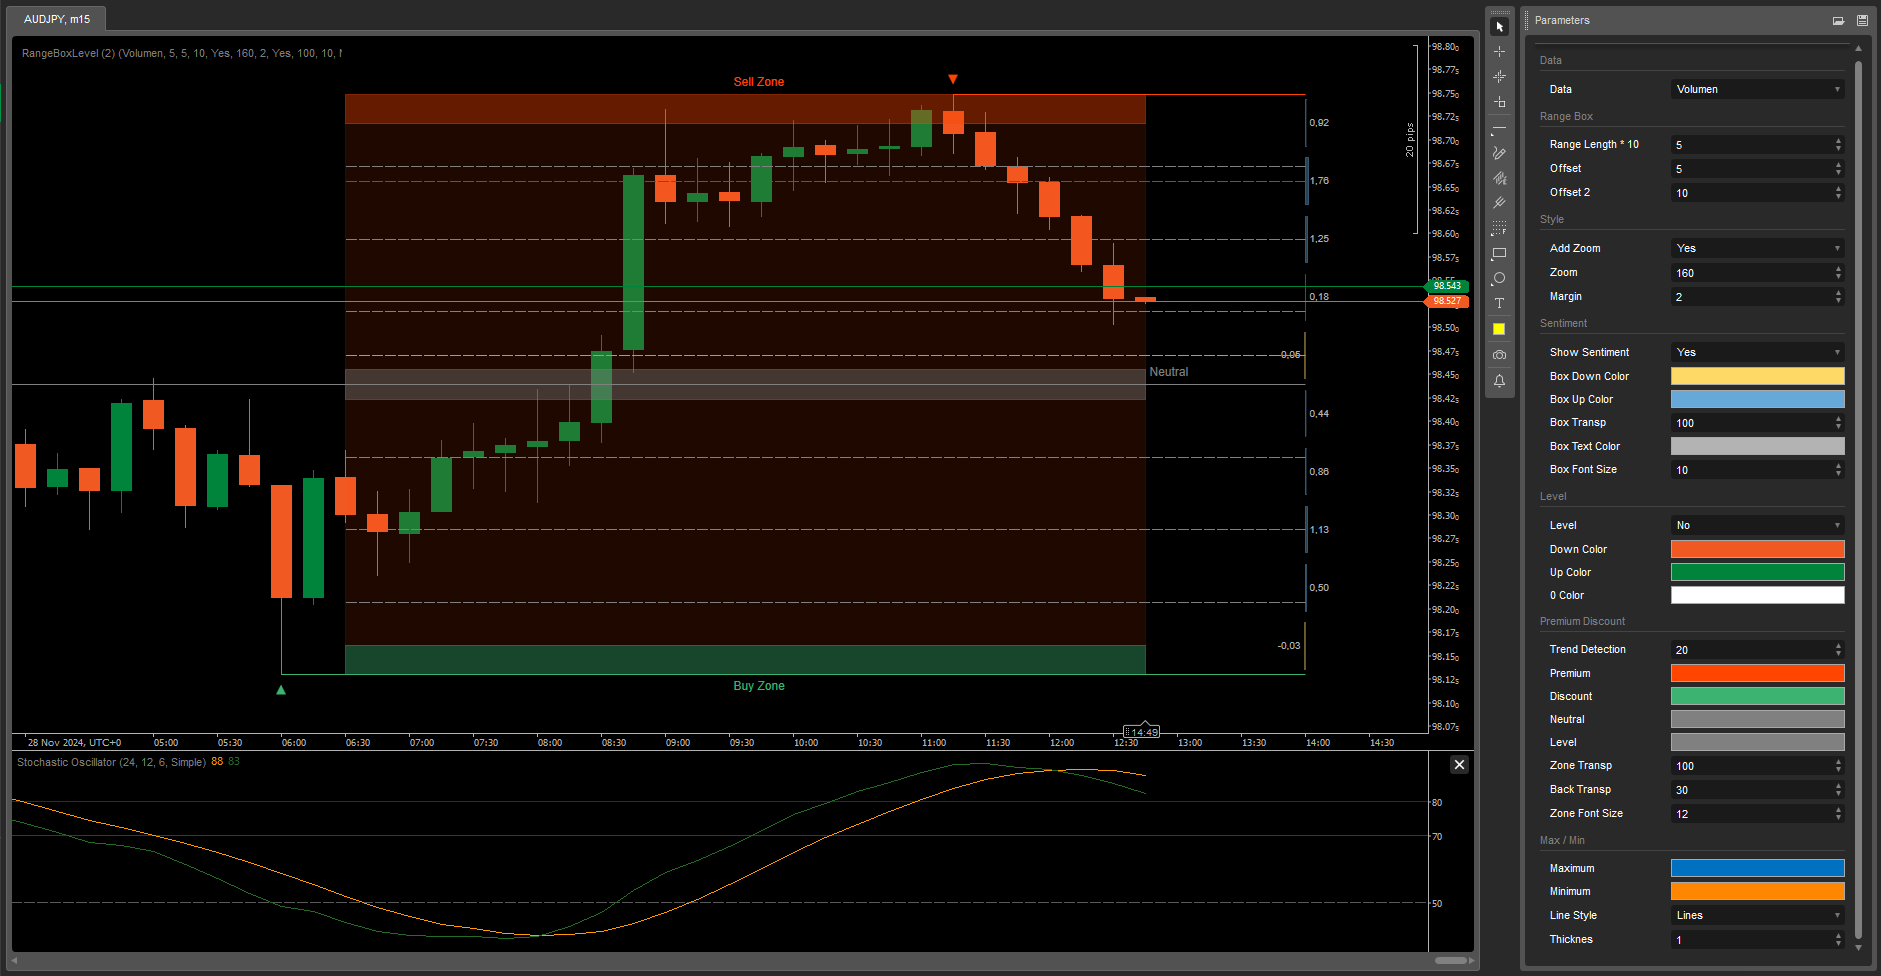
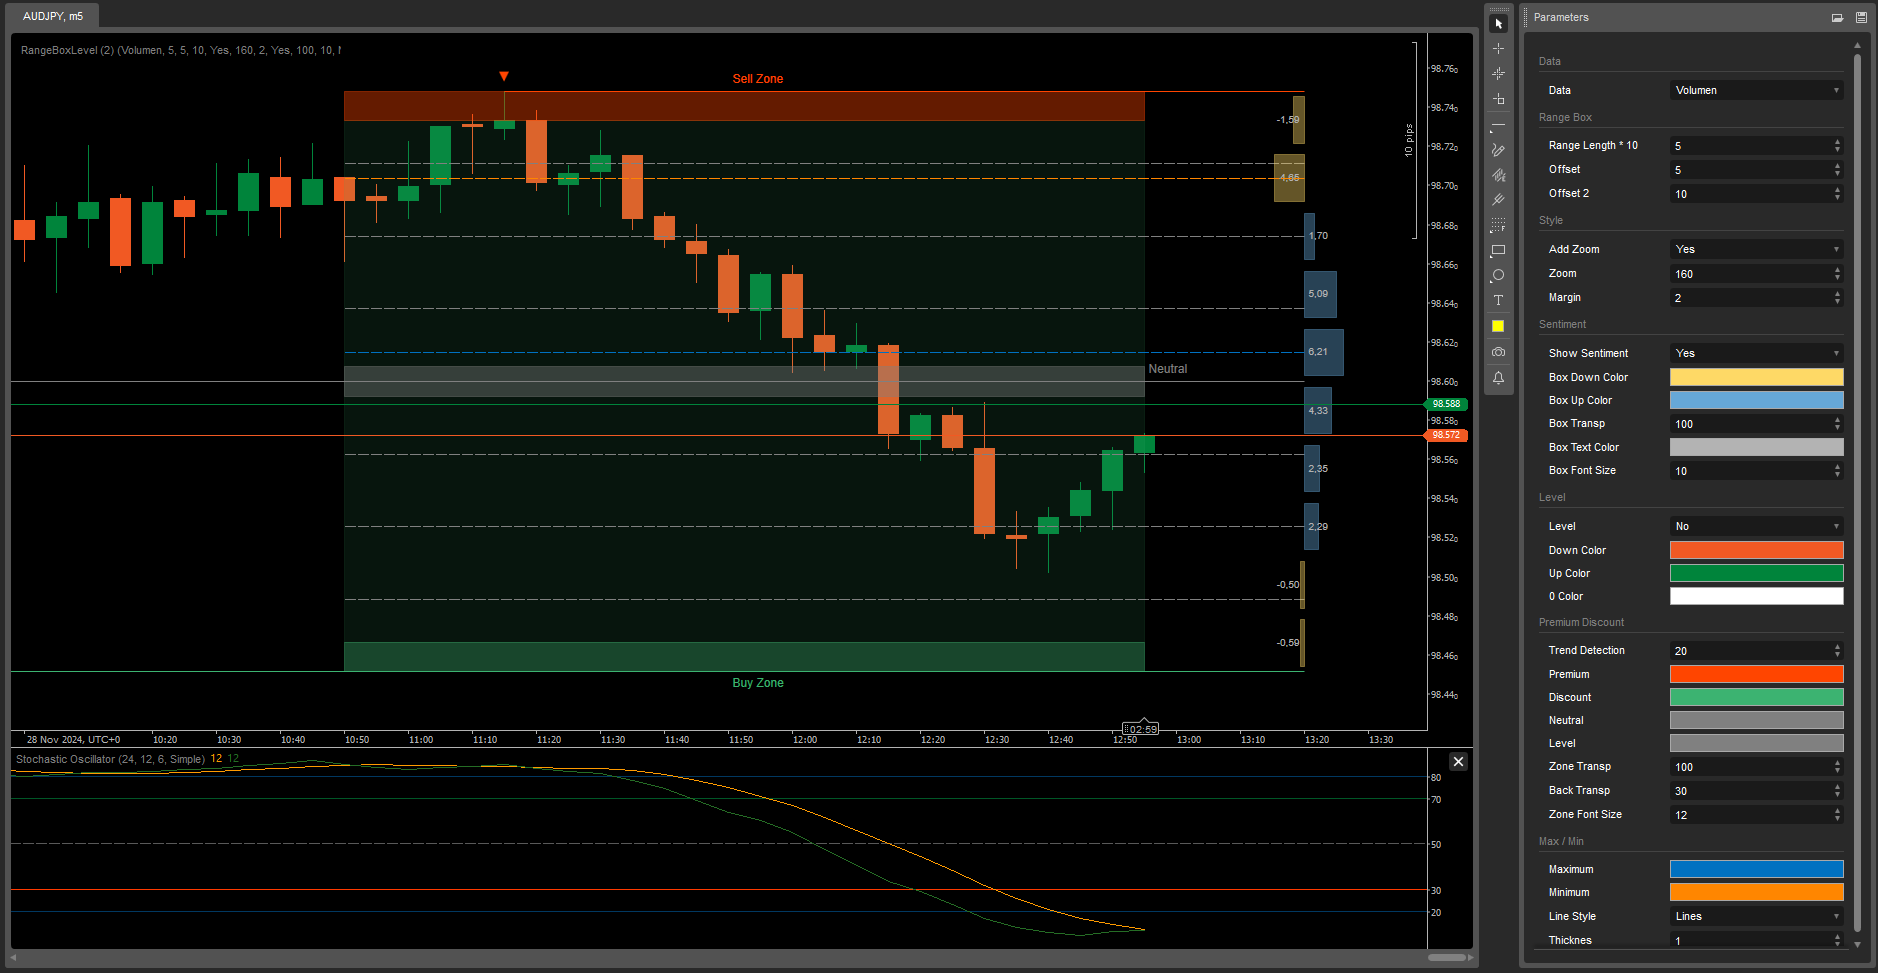
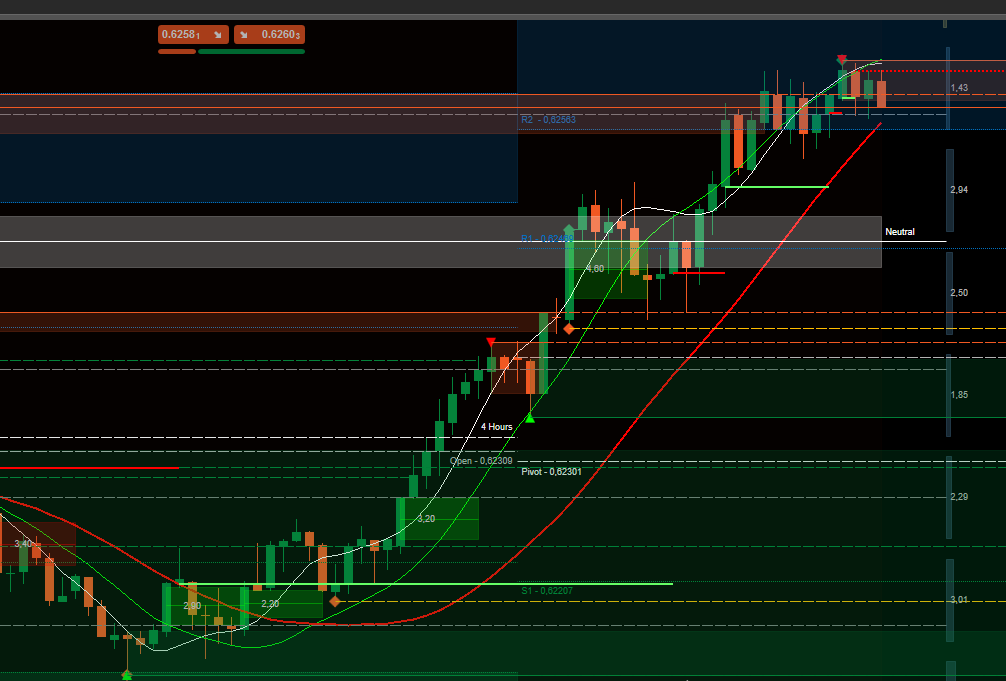
Depending on the trend of the asset, the background of the Range Box changes: green if it is bullish and red if it is bearish.
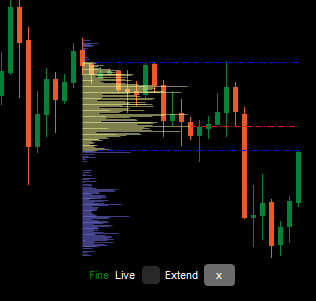
Max / Min

These are the blue and yellow lines that change their position according to the prediction of where the price might go. The Range Box is divided into 9 sections to help determine the price inflection points, serving as a Fibonacci Retracement.


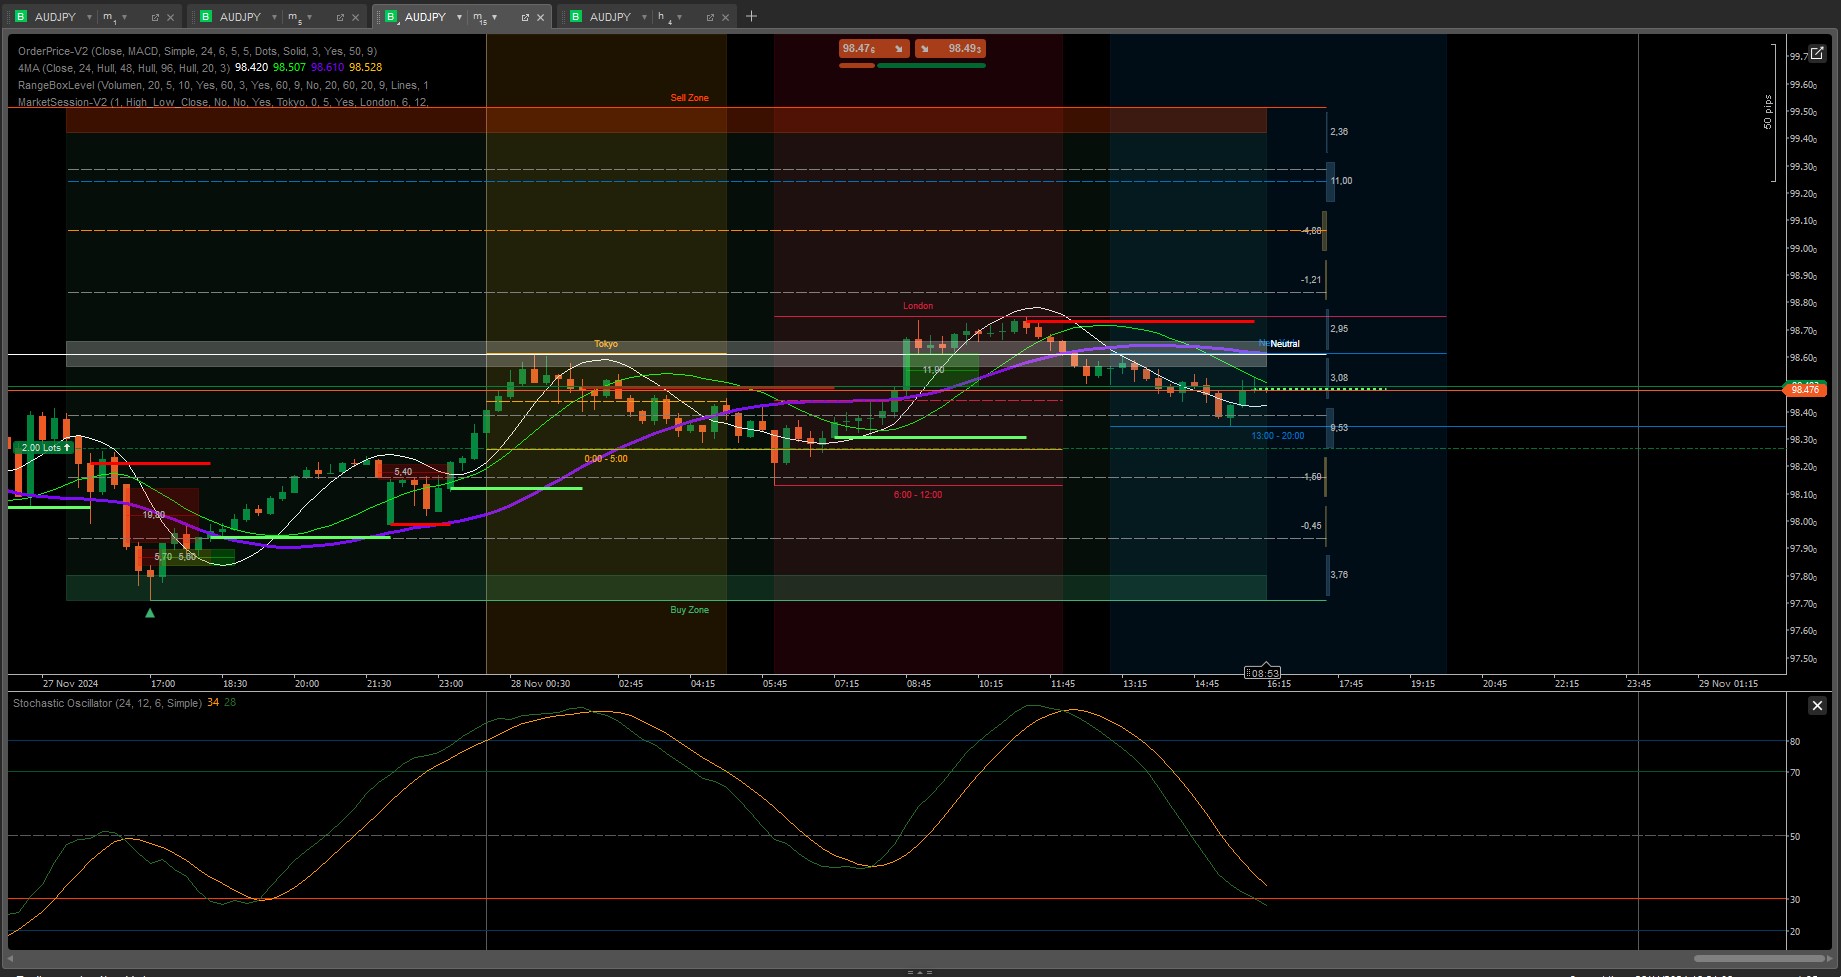
With additional tools like

OrderPrice V3 https://ctrader.com/products/397

NTMPICLL https://ctrader.com/products/327

Range Box Level https://ctrader.com/products/245

Or RangeBoxFibonacci https://ctrader.com/products/526

Market Session https://ctrader.com/products/94

MacdVolume https://ctrader.com/products/267

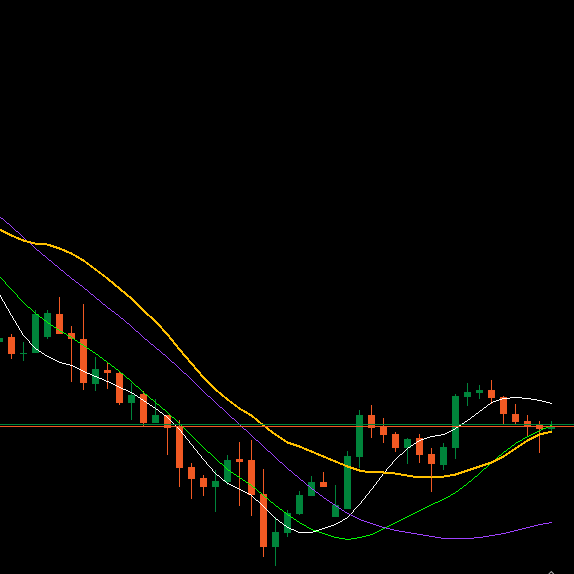
4MA https://ctrader.com/products/247

You will be invincible

Good luck 😀

More from this author
Indicator
Indices
Prop
Commodities
+3
4MA
This indicator consists of 3 moving averages that can be configured to your liking, from the type of moving average....
Indicator
NAS100
NZDUSD
XAUUSD
+10
MarketSession-MX
😎Read the description before purchasing💩
VWAP-Free
VWAP only timeframe
Indicator
Stocks
Forex
MACD
MACDVolume
😎Read the description before purchasing💩
cBot
Commodities
MACD
SparrowBot-FreeTrial-V2
This bot can automatically generate buy and sell orders based on three specific Fixed bugs
Indicator
Grid
NAS100
NZDUSD
+15
RangeBoxFibonacci
With this Fibonacci retracement indicator, traders have full control over the retracement levels displayed on the chart.
Indicator
NAS100
NZDUSD
XAUUSD
+11
SessionOne
Session One is a tool for marking from to, useful if you've set the hours you want to trade
Indicator
Grid
Indices
Prop
+8
TSPivotSMC
Pivot Point MultiTimeFrame with Order Block
Indicator
Grid
NAS100
NZDUSD
+16
AllPattern
🔍 Discover All Candlestick Patterns… Absolutely Free!
Indicator
Indices
RSI
Commodities
+1
OrderPrice-V3
A straightforward yet effective tool signals entry points for both buying and selling. Include 3 Moving Average
Indicator
Indices
Prop
Stocks
+5
New Way Sar - Free
The Parabolic SAR, or "Stop and Reverse," is a dynamic technical analysis tool
Indicator
RSI
Indices
Stocks
+3
FiboTrend-Pro
😎Read the description before purchasing💩
Indicator
Grid
NAS100
NZDUSD
+15
TS_Pivot
Those who are involved in trading know how important it is to take into account the previous session. With Order Block
Indicator
Indices
Prop
Breakout
+7
NTNPICLL
NTNPICLL is a tool to check the best trading hours for the assets and also includes the highest and lowest point
Indicator
NAS100
RSI
NZDUSD
+18
HAIQuantum-V10
The HAI Quantum V10 is an advanced indicator designed for technical analysis
Plugin
Breakout
Signal
RiskRewardCalculator
The Risk-Reward plugin is a tool to visualize a trading idea based on other analysis tools,
Indicator
Indices
Prop
Stocks
+4
Pivot Point Smart Money Concept
Transform your approach to trading with our innovative Pivot Point Indicator.
Indicator
Indices
Prop
Stocks
+6
New Way Sar - Pro
The Parabolic SAR, or "Stop and Reverse," is a dynamic technical analysis tool
You may also like
Indicator
Signal
MeetAlgo_ChannelTrading_cTrader
Channel Trading is a volatility-based indicator using envelope theory to spot price breakouts and trade signals.
Morning Star On Chart
Morning Star pattern on chart (Bullish and Bearish) automatically marked with (BUY & SELL) Very powerful signals.
Supply Demand - BasicV1
Supply and demand zones. They're important. Here's a free version to get you started!
Indicator
Commodities
Forex
Compra e Venda
Indicador Compra e Venda é um rastreador de tendência.
Indicator
NAS100
NZDUSD
Martingale
+26
ICT Killzones
ICT Killzones plots Asian, London & New York trading sessions on your cTrader charts with clear zones & labels.
LT Flexible Volume Profile
Flexible Volume Profile, designed with performance in mind.
Indicator
Indices
RSI
Signal
+1
[Stellar Strategies] QQE
The QQE indicator is a technical analysis tool designed to identify potential trend changes and trading signals 📈📉
Indicator
Indices
Breakout
Stocks
+2
VegaXLR - cTrader Pitchfork & Channel Enhancer
Enhance Pitchfork & Price Channels in cTrader with customizable Equidistant and Fibonacci levels.
Order Flow
Volumen Delta", es una representación visual del flujo de órdenes basada en el volumen de transacciones.
DailyPivotPoints
Daily Pivot Points plots key support and resistance levels to guide precise trading decisions.
Indicator
RSI
XAUUSD
Breakout
+6
PREMIUM SSL CHANNEL
SSL Channel: Tracks trends 📈 measures volatility ⚡filters noise via ATR+SSL. Clear signals for precise entries/exit...
Indicator
Signal
Scalping
Major Tops and Bottoms
Average accuracy of around 60% to 70% on 45min timeframes it is highly recommended to use stop losses
Cumulative Delta Candles + VolumeProfile
Cumulative delta candles + volume profile
Indicator
Indices
Prop
Forex
+1
Vision - Advanced Session Indicator
Indicator
ATR
Forex
RISK V1
Automated position sizing based on risk, entry, and stop loss with ATR support and visual trade setup on charts.
Indicator
RSI
ATR
Signal
+1
Trading Fusion Bars 2
This indicator works best as a trend-confirmation tool—wait for multiple signals!
VixFix
A volatility spike detector based on Larry Williams’ VIX Fix. Highlights market fear moments with clear histogram signal
Open Trade ProfitV1
A simple indicator that tracks the value of your open trades in pips.