Indicator
Signal
MACD
TradingViewMACD
"TradingViewMACD" logo
03/09/2025
3
Desktop
Since 22/11/2024
Traded volume
5.05M
Pips won
121.23K
Sales
67
Free installs
1902
"TradingViewMACD" uploaded image"TradingViewMACD" uploaded image"TradingViewMACD" uploaded image

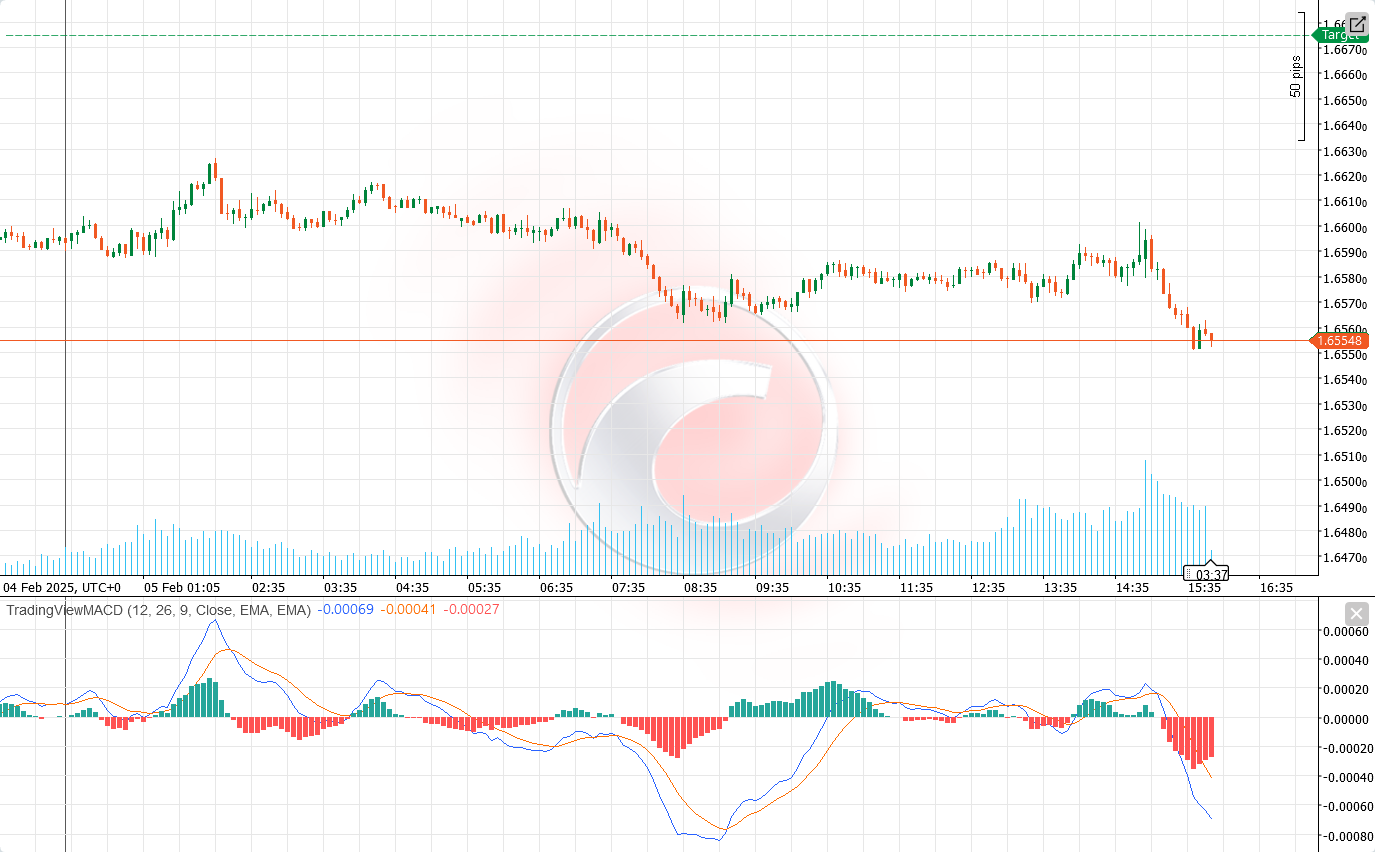
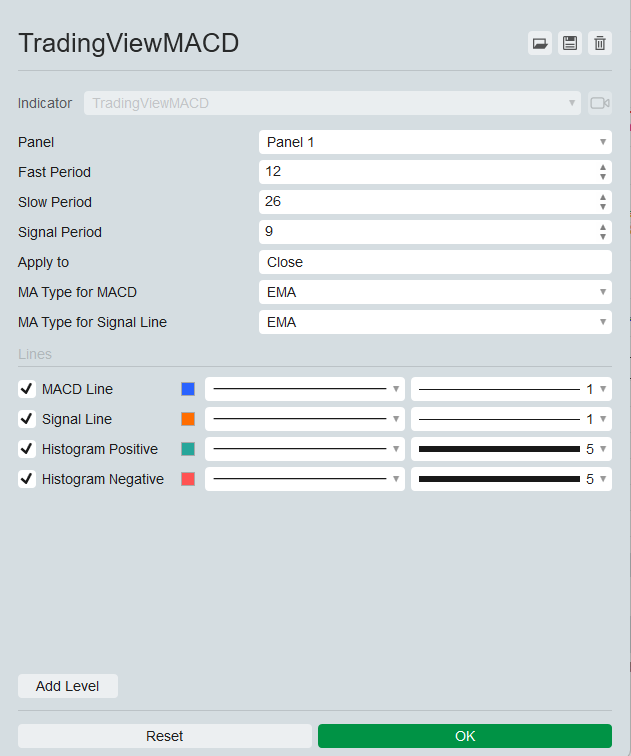
TradingViewMACD Indicator

Elevate your trading strategy with our highly customizable TradingViewMACD indicator, designed for the cAlgo platform. This powerful tool combines the flexibility and precision needed to optimize your market analysis.

Key Features:

  1. Customizable Parameters:
    • Fast Period: Adjust the fast moving average period to suit your trading style.
    • Slow Period: Configure the slow moving average period for enhanced signal accuracy.
    • Signal Period: Set the signal line period to fine-tune your entry and exit points.
    • Applied Price: Choose from open, high, low, close, median, typical, or weighted prices to apply the indicator.
  2. Multiple Moving Average Types:
    • Select between Simple Moving Average (SMA) and Exponential Moving Average (EMA) for both the MACD line and signal line, providing flexibility in your analysis.
  3. Visual Outputs:
    • MACD Line: Displayed in a striking blue color for clear visibility.
    • Signal Line: Highlighted in vibrant orange to easily distinguish from the MACD line.
    • Histogram: Differentiates between positive and negative values with green and red colors respectively, offering a clear visual representation of market momentum.
  4. Enhanced Market Insights:
    • The indicator calculates the difference between the fast and slow moving averages to generate the MACD line.
    • Computes the signal line as the moving average of the MACD line.
    • The histogram visually represents the difference between the MACD line and the signal line, helping you identify potential buy and sell signals.
  5. User-Friendly:
    • Easy to install and configure, allowing traders of all levels to benefit from its advanced features.
    • Comprehensive documentation and customer support to ensure a seamless experience.

Unleash the full potential of your trading strategy with the TradingViewMACD indicator. Enhance your market analysis, make informed decisions, and stay ahead of the curve with this essential trading tool.

More from this author
Indicator
Indices
RSI
Stocks
+3
Advanced RSI Indicator
Advanced RSI Indicator with multi-MA smoothing, Bollinger Bands, divergence detection, and fill zones for cTrader.
Indicator
Stocks
Commodities
Forex
+1
Support & Resistance Pro
The Support & Resistance Pro helps traders identify key support and resistance levels for informed trading decisions.
FibonacciStrategyCBot
FiboSmart cBot automates Fibonacci-based trading with trend, RSI, and MACD filters, plus built-in money management, trai
Indicator
RSI
MACD
Multi-Timeframe Market Levels
Unlock market insights with our Multi-Timeframe Market Levels indicator, enhancing your trading strategies effortlessly
Indicator
ATR
Stocks
Commodities
+2
LevelMaster SR
LevelMaster S/R: Pinpoint key support & resistance zones with precision. Perfect for traders of all levels Trade smarter
Indicator
Indices
Stocks
Forex
+4
MACD Pro Trader
🚀 MACD Pro Trader – Advanced MACD with buy/sell signals, custom MAs & color-coded histograms for smarter trading! 📈🔥
Indicator
VWAP
Indices
RSI
+4
ProVWAP
Advanced Anchored VWAP for cTrader: volatility bands, real‑time alerts & customizable session resets.
Indicator
RSI
EURUSD
MACD
Supply&Demand
Precision Supply & Demand zones indicator—automatically plots key buy/sell areas on your chart for smarter entries.
Indicator
Breakout
AutoLines™ Support & Resistance
FlexSR auto‑detects pivot highs/lows to plot dynamic support & resistance lines Features customizable styling and option
Indicator
RSI
Breakout
XAUUSD
+1
ZigzagSR
Automatic ZigZag swings with dynamic support & resistance levels, labeling highs/lows for clear trend signals.
SmartFibonacci
SmartFibonacci — automatic Fibonacci retracements & extensions with swing detection, alerts and clean labels for cTrader
Indicator
Breakout
Stocks
Commodities
+1
Advanced Donchian Zones
MTF Donchian: Identify trend breakouts & key zones with precision. Perfect for swing & day traders seeking accuracy!
Indicator
NAS100
NZDUSD
Martingale
+26
ICT Killzones
ICT Killzones plots Asian, London & New York trading sessions on your cTrader charts with clear zones & labels.
You may also like
Indicator
Bollinger
E7 Indicators Free Overlays
Bollinger Band Cloud, Heiken Ashi, Trend Follower and Parabolic SAR.
IR Spread
show spread on chart
Indicator
RSI
XAUUSD
Breakout
+4
ICT Power of 3
🎯 Auto-plots key zones (Accumulation, Manipulation, Distribution) . Reveals institutional traps & trends.
Indicator
Indices
XAUUSD
Breakout
+3
AnchoredVWAP
A precision overlay tool that combines session-aware VWAP logic and standard deviations.
KAMA
Custom KAMA Indicator – Optimized for Speed and Precision
Indicator
XAUUSD
Commodities
Forex
+10
Perfect Entry Price
Perfect Entry Price designed to help traders identify the most accurate and reliable price levels for market entries
Break of Structure
The Break of Structure (BoSCHoCh) Indicator is a smart market structure tool designed to help traders easily spot trend.
Indicator
ATR
Forex
Signal
+4
Follow Line
The Follow Line Indicator is a versatile tool designed to identify market trends and provide accurate buy/sell signals.
Indicator
RSI
XAUUSD
Breakout
+6
Order Block
Identify bullish and bearish Order Blocks to spot key support/resistance levels and potential trend reversals! 📈🔄
Indicator
NAS100
NZDUSD
XAUUSD
+7
Bayesian Price Projection Model
Bayesian theory** to forecast a future price while providing **uncertainty ranges** that represent upper and lower bound
Indicator
RSI
Breakout
XAUUSD
+5
Shielded Trend
Buy/Sell signals filtering noise, color-coded trends & strength shield 🛡️. Trade only with POWER ⚡
DMI 3 bar v2
Shows BUY & SELL signals for 3 & 4 BAR PATTERN (Morning star/ Evening star). It is adjustable and it will SHOW ARROWS.
Indicator
Indices
RSI
Signal
+1
[Stellar Strategies] QQE
The QQE indicator is a technical analysis tool designed to identify potential trend changes and trading signals 📈📉
DMI CUSTOM SESSIONS
This will allow you to have SESSIONS on the chart. London, New York, Asian session and you can customize the times.
Indicator
RSI
Breakout
XAUUSD
+6
Multi-Asset Performance Matrix
Visual tool tracking financial assets' % performance across timeframes, highlighting trends with color-coded insights.
IR VLine
don't move to the end of chart after timeframe changing. it should be better to use for near history. for long history