Indicator
XAUUSD
Commodities
True Open Pivot Levels
"True Open Pivot Levels" logo
03/09/2025
Desktop
Since 19/11/2024
Sales
15
Free installs
2443
"True Open Pivot Levels" uploaded image"True Open Pivot Levels" uploaded image"True Open Pivot Levels" uploaded image

*TIME OPENING WILL BE DIFFERENT BETWEEN ASSET CLASSES

*DEFAULT TIME VALUES ARE FOR NQ/ES/YM (FUTURES)

*TIME VALUE SHOULD BE IN EASTERN STANDARD TIME (EST)


Key Features:

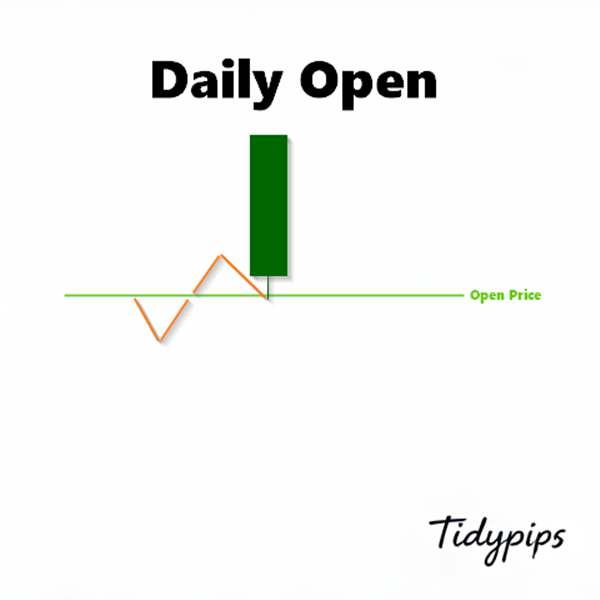
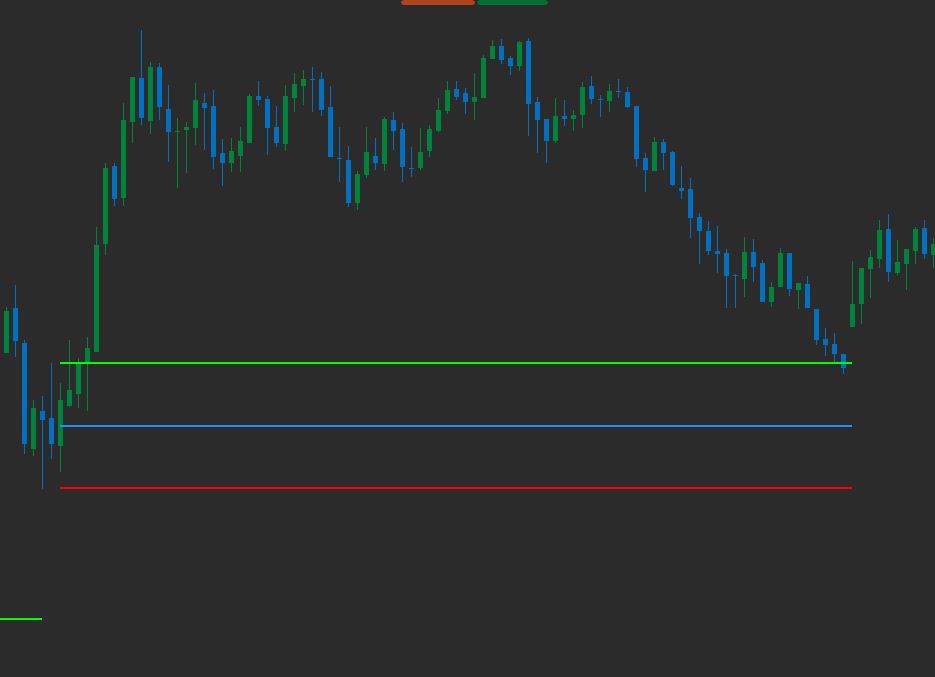
Time-Based Price Levels

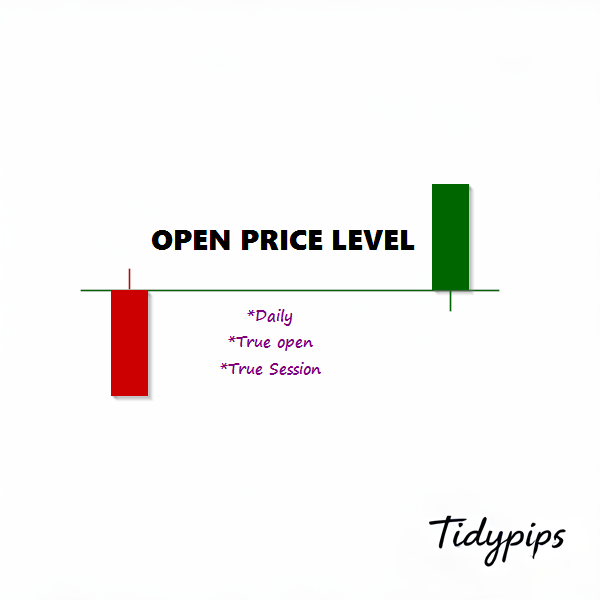
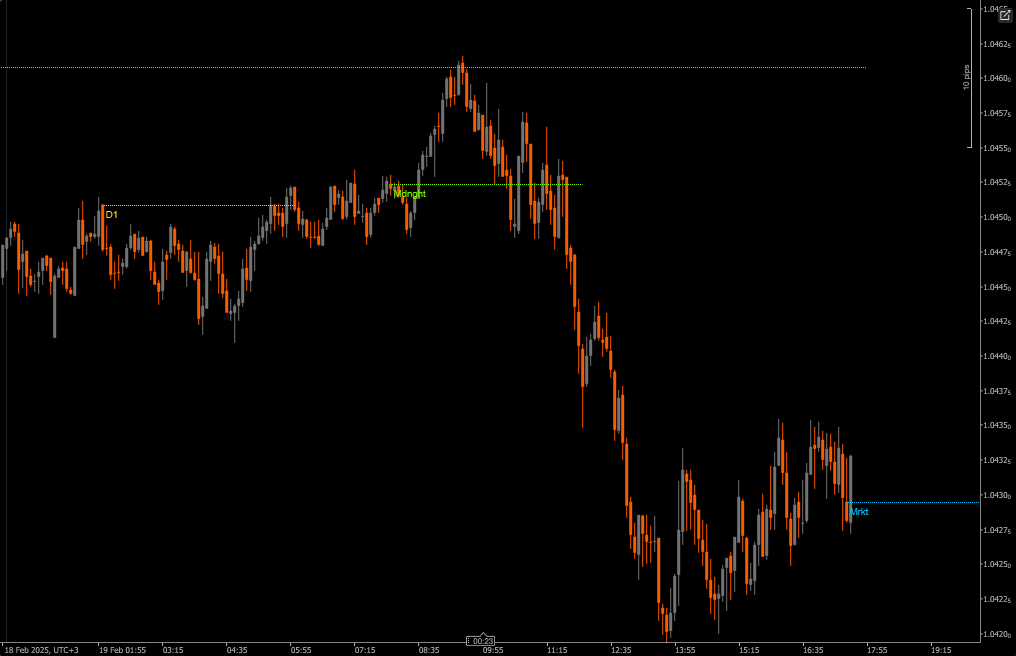
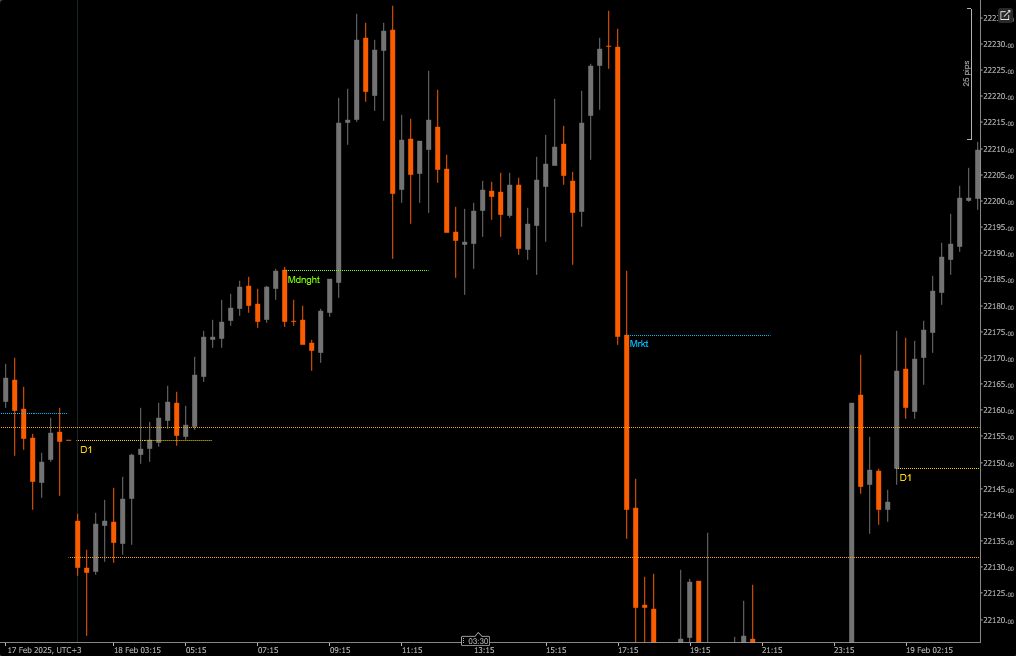
Plots open price lines at the opening price of key market times

All times are synchronized to Eastern Standard Time (EST)

Each time period is color-coded for easy identification


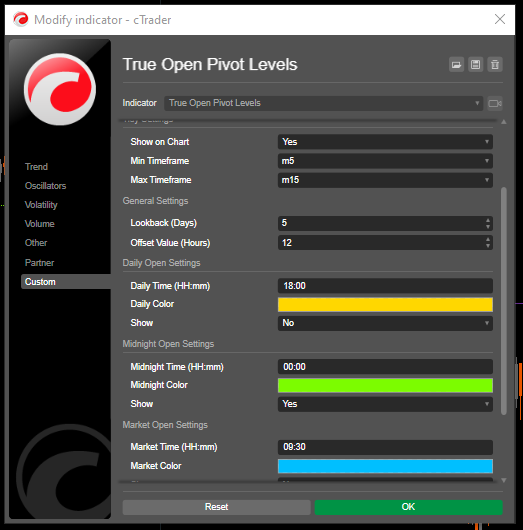
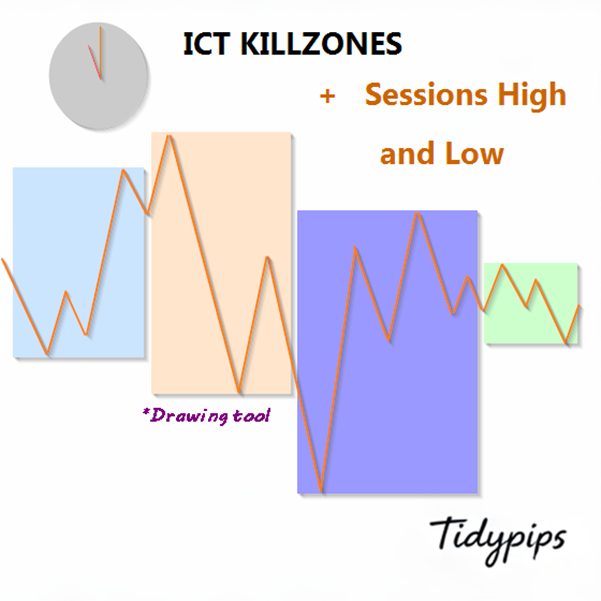
3 Customizable Session Markers:

Daily Open (12:00 AM EST) - Default Gold

Midnight Open (4:00 AM EST) - Default Green

Market Open (9:30 AM EST) - Default Blue

Each session can be toggled on/off independently


Visual Customization:

Adjustable line thickness

Multiple line styles (solid, dotted, dashed)

Customizable colors for each session

Optional time labels showing EST times

Line offset configurable up to 48 hours


Flexible Time Frame Support:

Set minimum and maximum timeframes for display

Prevents chart cluttering on inappropriate timeframes

Optimized for M5-M15 timeframes

Time Settings:

All times are in EST

Customize session times to match your trading strategy

Adjust line duration based on your analysis needs


Visual Settings:

Adjust line thickness for visibility

Choose line style based on chart clarity

Enable/disable labels as needed

Customize colors to match your chart theme


General Settings:

Define minimum/maximum timeframes

Adjust line duration for extended analysis


Best Practices:

Start with default settings and adjust based on your needs

Use different colors for each session for clear differentiation

Consider reducing line duration on lower timeframes to prevent cluttering

Enable labels initially to understand the timing, disable if chart becomes too busy

Match the indicator timeframe settings to your trading timeframe


This indicator is particularly useful for:

Day traders focusing on US markets

Traders who need to track session opens

Those who trade around major market events

Traders analyzing multi-session price action

Anyone needing clear visual reference for EST market times


More from this author
ICT Killzone and Sessions high_low
This indicator is an essential tool for traders seeking to visualize key trading sessions on their charts.
Indicator
XAUUSD
Commodities
FVG_tidypips
A Fair Value Gap (FVG) indicator that identifies potential price imbalances, potential reversal and continuation zones
Previous Day Liquidity Zones (PDH - PDL)
Useful indicator for traders who want to visualize key price levels based on previous daily highs and lows.
Daily Open Pivot Level
This indicator is a valuable tool for traders looking to identify significant opening price level of any asset.
Moving Average channel
This indicator is designed to display customizable moving averages (MAs) on a chart.
Previous Day Equilibrium (Premium & Discount)
Plots the equilibrium price levels based on previous daily highs and lows.
Drawing Utility
A rectangular box with 5 adjustable Fibonacci level or even custom ones.
You may also like
Laguerre RSI
Laguerre RSI is based on John EHLERS' Laguerre Filter to avoid the noise of RSI.
Top-rated
Free
FairValueGap
This Fair Value Gap (FVG) indicator is a technical analysis tool used to identify potential price imbalances.
Indicator
Breakout
ATR
LT_SmartSwings
Detects swing highs/lows, structure, breakouts, trend lines, and fibs — great for price action trading.
Vice TrendTrading
Unlike most indicators that show signals blindly, this show valid entries inside TREND ZONES and visual trend BACKTESTS.
Indicator
VWAP
RSI
XAUUSD
+9
Turtle Soup ICT Strategy
Turtle Soup ICT Strategy – Detect liquidity traps & trade smart money moves with precision on cTrader.
Indicator
Breakout
AutoLines™ Support & Resistance
FlexSR auto‑detects pivot highs/lows to plot dynamic support & resistance lines Features customizable styling and option
IR Slowing Moving
Add Slowing to IR Moving Average.
Indicator
Indices
AI
Machine Learning Momentum Index
The Machine Learning Momentum Index (MLMI) represents the next step in oscillator trading.
Anchored VWAP Buttons
Indicator
RSI
Breakout
XAUUSD
+5
Shielded Trend
Buy/Sell signals filtering noise, color-coded trends & strength shield 🛡️. Trade only with POWER ⚡
Indicator
NAS100
Indices
Breakout
+7
ORB Range with FVGs
This indicator plots the 15m opening range of the NY session with the first N FVGs presented on the chart after the open
Indicator
Scalping
ACTO-v1
ACTO: Oscillator tracking average candle duration to anticipate volatility shifts in trading.
HMA MTF 2.0
HMA MTF 2.0 (Multi-Timeframe )
Indicator
Signal
Master Dragom SR
Indicator,combines with several strategies.MA locate trends,pullback, signal volumes, reversals, support and resistance
Indicator
Forex
Signal
MACD
swingh6
Swing-Trading Indicaotr for pairs like EUR/USD, AUD/USD, and USD/JPY. Most effective on higher time frames H4,H6,H12...
Indicator
Indices
RSI
XAUUSD
+5
cAlgoBuddy - Composite Index RSI
What Constance Brown did with the RSI was to input a momentum calculation within the RSI itself. This the Composite RSI.
Indicator
RSI
XAUUSD
Breakout
+6
Order Block
Identify bullish and bearish Order Blocks to spot key support/resistance levels and potential trend reversals! 📈🔄