Description
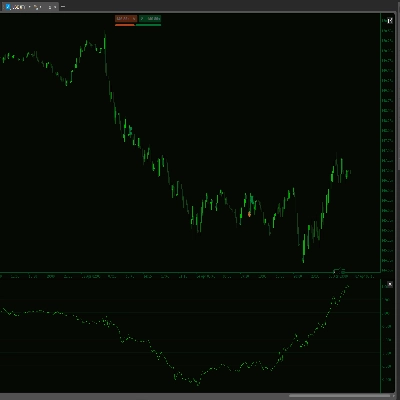
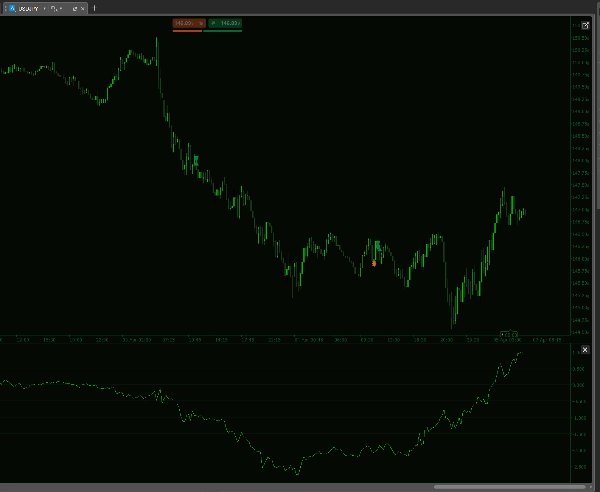
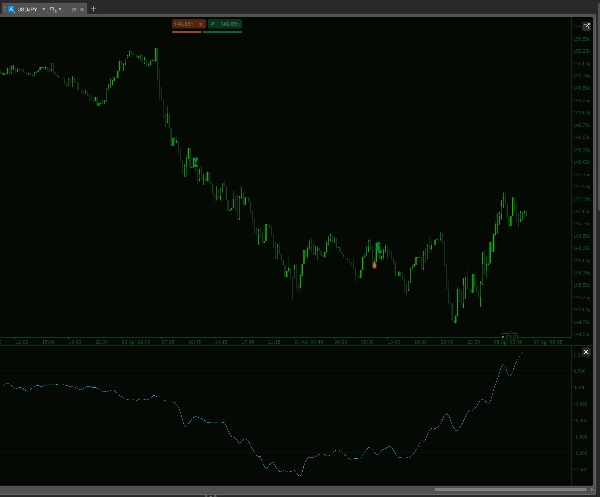
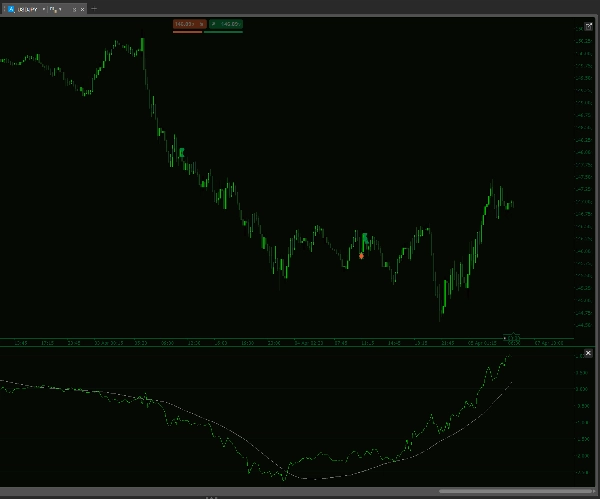
Élevez votre stratégie de trading avec le Indicateur Historique DXY HMA—un outil cTrader de pointe conçu pour la précision et la performance. Cet indicateur avancé calcule un indice personnalisé du dollar américain en combinant les variations en pourcentage pondérées de six paires de devises clés, vous fournissant une jauge de marché dynamique et fiable.
Caractéristiques principales :
- Calcul personnalisé du DXY : Intègre six paires USD majeures (EURUSD, USDJPY, GBPUSD, USDCAD, USDCHF, USDSEK) avec des poids configurables pour un indice finement ajusté.
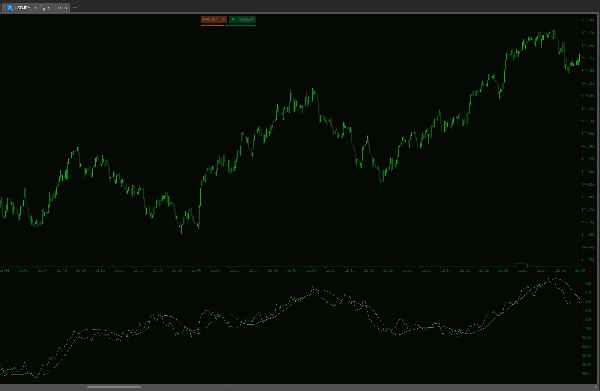
- Doubles moyennes mobiles Hull : Utilise à la fois des moyennes mobiles Hull à court et long terme pour offrir une image claire des tendances et du momentum du marché.
- Lissage de la pente : Améliore la détection des tendances avec une pente HMA lissée, vous donnant un avantage pour identifier les retournements de marché.
- Gestion robuste des données : Se synchronise parfaitement avec votre plateforme cTrader, garantissant une analyse précise en temps réel même avec des sources de données variées.
- Paramètres personnalisables : Ajustez finement les nombres de périodes de retour en arrière et les périodes des moyennes mobiles pour correspondre parfaitement à votre style de trading et aux conditions du marché.
Conçu pour le trader moderne, l'Indicateur Historique DXY HMA simplifie les données complexes du marché en informations exploitables, vous permettant de prendre des décisions de trading plus intelligentes et plus confiantes. Découvrez le niveau supérieur de l'analyse de marché !
--------------------------
N'hésitez pas à consulter mes autres indicateurs !
https://ctrader.com/products/1181
https://ctrader.com/products/1182
https://ctrader.com/products/1180
https://ctrader.com/products/1015
https://ctrader.com/products/555
https://ctrader.com/products/553
https://ctrader.com/products/554
https://ctrader.com/products/552
https://ctrader.com/products/557
https://ctrader.com/products/845
https://ctrader.com/products/848
https://ctrader.com/products/847
https://ctrader.com/products/846
https://ctrader.com/products/551
https://ctrader.com/products/574
https://ctrader.com/products/573
https://ctrader.com/products/556
https://ctrader.com/products/558
https://ctrader.com/products/559
https://ctrader.com/products/560


