Description
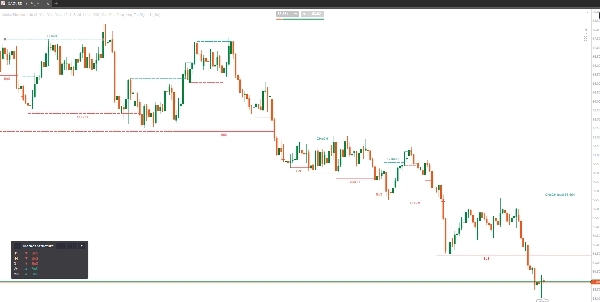
MarketStructureLite draws Smart Money Concepts market structure on your chart – Break of Structure (BoS) and Change of Character (CHoCH) – using clear, mechanical rules, so your bias is never guesswork.
HOW IT WORKS
• Swing highs and lows are confirmed with fractal pivots (adjustable Swing Strength).
• Only external structure is tracked. Internal swings inside a leg are ignored.
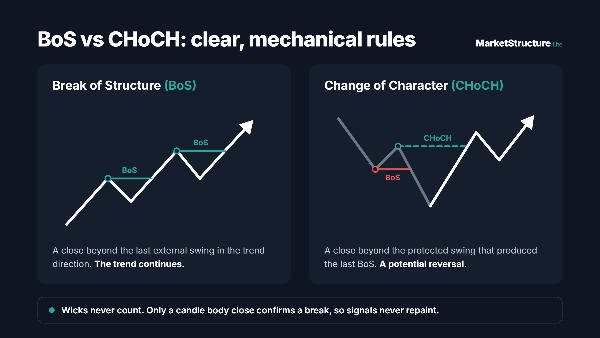
• A break needs a candle BODY CLOSE beyond the level. Wicks never count.
• BoS = trend continuation: a close beyond the last external swing in the trend direction.
• CHoCH = potential reversal: a close beyond the protected high or low that produced the last BoS.
• Signals print on the close of the breaking candle and never repaint.
FEATURES
• Lines at the exact swing price, from the swing candle to the breaking candle, labelled BoS or CHoCH
• Bullish and bearish colours, separate line styles for BoS and CHoCH
• Show or hide BoS and CHoCH lines independently
• Live levels: the current BoS target and CHoCH level extend to the right with their exact price
• Drag any BoS or CHoCH line further to the right – price and start point stay locked
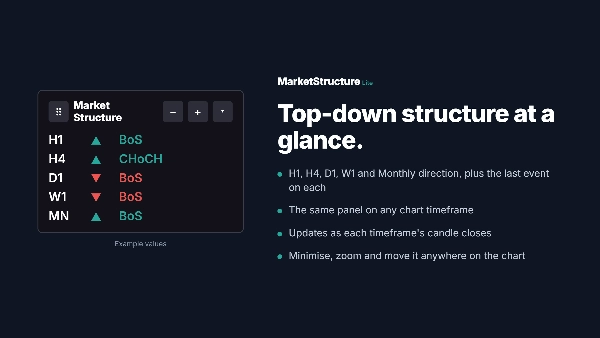
• Multi-timeframe trend dashboard: H1, H4, D1, W1 and Monthly direction plus the last event, on any chart timeframe
• Dashboard can be minimised, zoomed and moved anywhere on the chart
• Lightweight: incremental calculation on closed bars only, with a cap on the number of drawings
PREFERRED PERIODS AND INSTRUMENTS
Works on every timeframe and symbol: forex, indices, metals, commodities and crypto. H1 is a good default for defining structure, M15 to H4 also work well, and lower timeframes can be used to refine entries.
TRADING USE CASES
• Setting your directional bias before you trade
• Trading with the trend after a BoS
• Spotting potential reversals early with CHoCH
• Top-down analysis with the H1 to Monthly dashboard
• Aligning entries with order blocks, fair value gaps and liquidity
MarketStructureLite is an analysis tool and does not place trades. Trading involves risk; use it as part of your own analysis and risk management.
Summary
Key features include exact swing price lines labeled BoS or CHoCH with distinct bullish and bearish colors, customizable visibility of these lines, and live extension of current BoS and CHoCH levels with price labels. Users can drag lines horizontally while maintaining price and start points. A multi-timeframe dashboard displays trend direction and last event from H1 to Monthly timeframes, which can be repositioned and resized on the chart. The indicator performs incremental calculations on closed bars with a limit on drawings to maintain efficiency.
MarketStructureLite supports all symbols and timeframes, including forex, indices, metals, commodities, and cryptocurrencies. It is suited for setting directional bias, trading with trends after BoS, spotting potential reversals with CHoCH, conducting top-down analysis, and aligning entries with order blocks and liquidity zones. This tool provides visual market structure analysis without executing trades.