


説明
Apex Break PROは重要なトレンドラインを描画し、それらのブレイクごとにスコアを付けます。
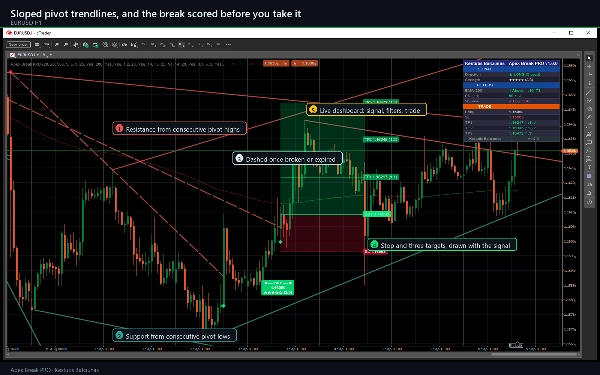
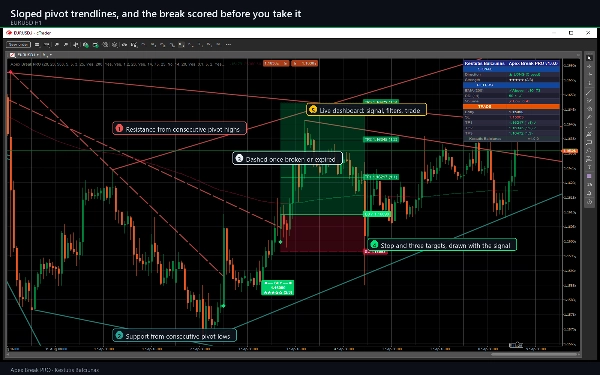
連続するピボット高値は傾斜したレジスタンスラインを形成し、連続するピボット安値は傾斜したサポートラインを形成します。これらは水平レベルではなく、市場の方向に沿っており、有効期限があります。シグナルは、確定したバーの終値がATRで測定されたマージン分だけこれらのラインのいずれかをクリアし、かつ十分な独立したフィルターが同意した場合に表示されます。
チャートに描画されるもの
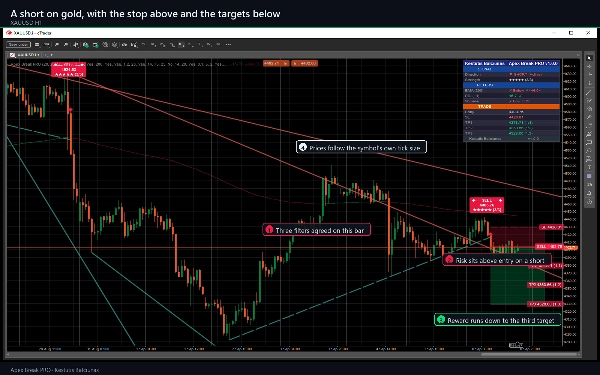
- 傾斜したレジスタンスおよびサポートのトレンドライン、それぞれ最大5本。生きている間は実線で、破られたまたは延長が終了した場合は破線になります。
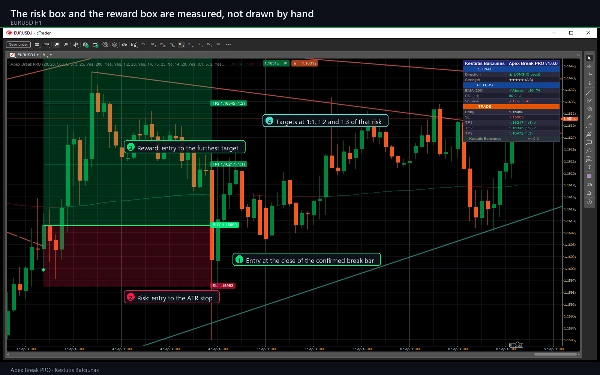
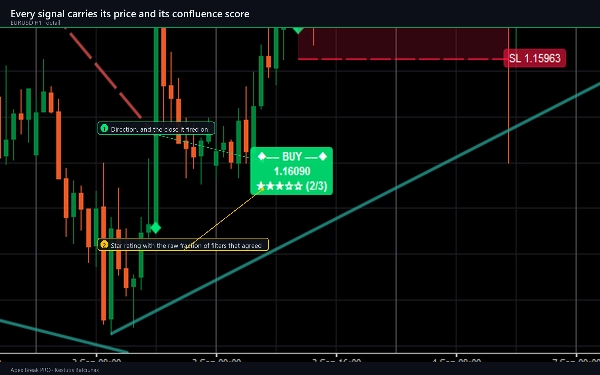
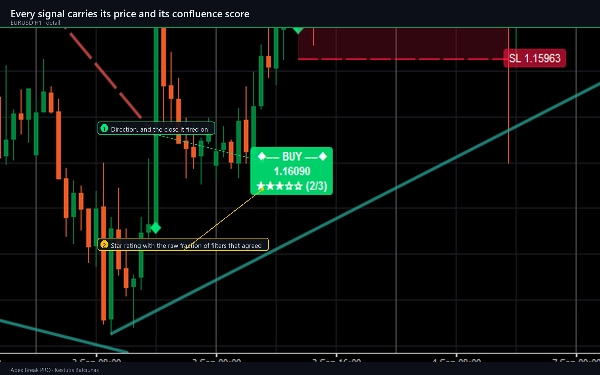
- 価格、5つ星評価、および例えば3/4のようなコンフルエンス比率を持つBUYまたはSELLマーカー。
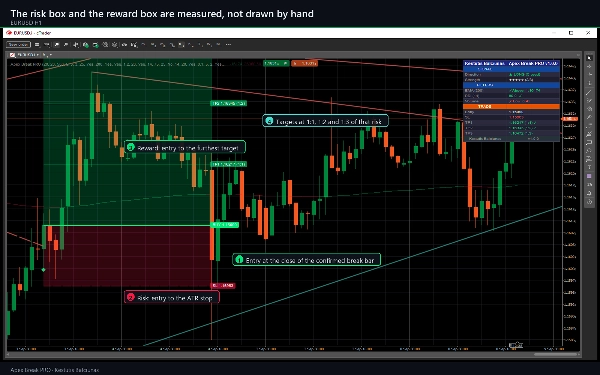
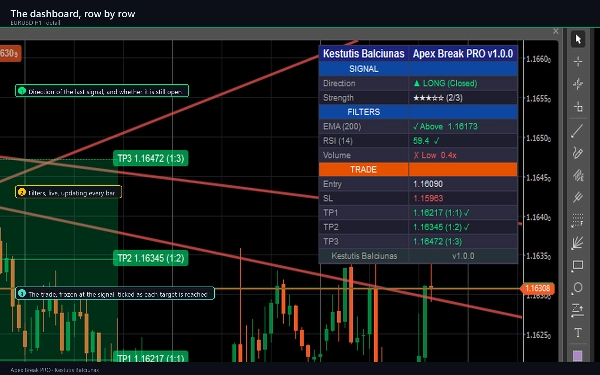
- デフォルトでATRの1.5倍のストップと、その距離の1:1、1:2、1:3の3つのターゲット、リスクゾーンとリワードゾーンのシェーディング付き。
- 価格が取引されている側によって色分けされた200 EMA。
- 2列のダッシュボードで、SIGNALセクション、ライブFILTERSセクション、各ターゲット到達時にマークするTRADEセクション。
使い方
- 履歴を与えます。デフォルト設定では、200 EMAのシードとピボットの確定に20バーかかるため、最初のラインが表示されるまで約250バー必要です。
- マーカーを待ちます。ブレイクは確定バーで評価されるため、マーカーは表示された後に動きません。
- 行動する前に星評価とFILTERS行を読みます。スコアは有効な条件のうちいくつがそのバーで同意したかを示します。これは確率ではなく合意の説明です。
- 描画されたストップとターゲットをそのまま使うか、自分のサイズ設定のテンプレートとして使用します。
- TRADE行を監視します。価格が各ターゲットに到達するとマークされ、ストップまたは3番目のターゲットで追跡が停止します。
- 必要なアラートをオンにします。9つの異なるイベントが利用可能です。
主な設定
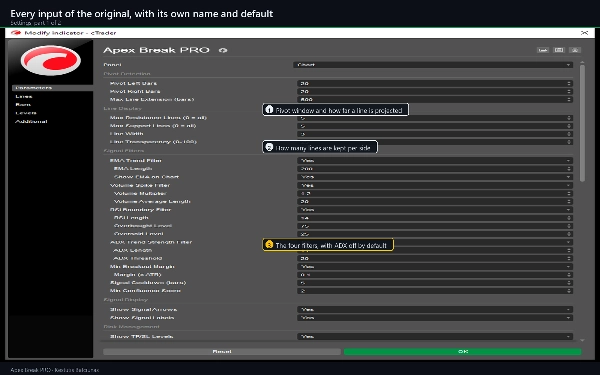
- ピボット検出:左右のバーともに20、最大ライン延長は500バー。
- ライン表示:最大5本のレジスタンスと5本のサポートライン、幅3、透明度25。
- シグナルフィルター:EMA 200; RSI 14(75と25の境界値付き); ボリューム 1.2x の20バー平均; ADX 14が20以上(デフォルトはオフ); ブレイクアウトマージンは0.1 x ATR; 5バーのクールダウン; 最小スコアは2。
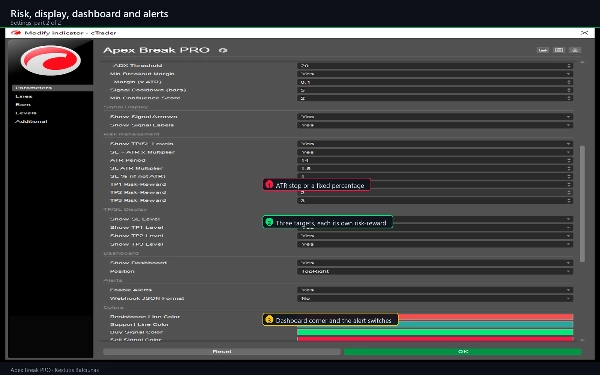
- リスク管理:ATR 14、ストップは1.5 x ATRまたは固定パーセンテージ、ターゲットは1:1、1:2、1:3。
- ダッシュボードは6つの位置に配置可能、9つのアラート切替、4つのラインとシグナルの色。
合計65のパラメータがあり、ピボット検出、ライン表示、シグナルフィルター、リスク管理、TP/SL表示、ダッシュボード、9つのアラート切替とその配信チャネル、色設定に分かれています。
インジケーターの種類、期間、対象銘柄、使用例
メインチャートに描画しシグナルを発するサポート&レジスタンス、トレンド、ボラティリティのインジケーターです。任意のシンボルと任意の時間枠で動作します。設計された時間枠はM15、H1、H4で、より短い期間はより多くのシグナルとタイトなATRストップを提供し、D1以上は少なく広いものを提供します。ボリュームフィルターはブローカーがボリュームを提供する場合に使用され、提供しない場合はオフにできます。典型的な使用例は、明示されたコンフルエンスを持つトレンドラインブレイクエントリー、ATRベースのストップ設定、1:1、1:2、1:3での段階的なエグジット、上位時間枠の確認、隠されたシグナル出力からのcBotへのフィードです。
対象ユーザー
すでに手動でトレンドラインを描いているトレーダーで、すべてのチャートで毎回同じ方法で描画され、ブレイクがスコア付けされてから行動したい方。これは分析ツールであり、注文の発注、変更、クローズは行わず、アカウントへのアクセスもありません。
トライアル版:フルバージョンで追加される機能
トライアルは同じビルドでEURUSDに限定され、時間制限なくすべてのパラメータが利用可能です。他のシンボルでは描画の代わりに通知が表示されます。フルバージョンはシンボルロックを解除し、ブローカーが提供するすべてのFXペア、インデックス、金属、エネルギー、暗号通貨シンボルに対応します。
技術的な注意点と制限
- シグナルは確定バーで評価され、再描画されません。ピボットはPivot Right Barsが形成された後にのみ確定し、その確認遅延は再描画しないための代償です。トレンドライン自体はまだ形成中のバーでは暫定的です。
- アラートはインジケーターを取り付けた後に閉じたバーに対してのみ発火し、履歴には発火しません。
- ターゲット行のマークは、価格が後にチャートの履歴上の描画レベルに触れたことを記録します。これは取引結果ではなく、スプレッド、手数料、スワップ、スリッページ、約定は含まれず、統計も導出されません。
- チャートは最新のシグナルラベルとトレンドラインを保持し、最も古いものを削除します。
- 2つのブローカーは同一のローソク足を持たないため、ライブチャート上のシグナルは別のフィード上の同じインジケーターとは異なります。これは計算の違いではなくデータの違いです。
- 要件:cTrader 5.0以上、5.9でテスト済み。アクセス権限:なし - ファイル、ネットワーク、取引アクセスなし。
サポート
このページのディスカッションタブまたは販売者への問い合わせから質問可能です。アップデートは無料でバージョン履歴に記載されています。ストアは14日間の返金期間を提供しています。インジケーターが役立った場合は、他のトレーダーが見つけやすくなるよう評価をお願いします。
取引にはリスクが伴います。過去のパフォーマンスは将来の結果を保証するものではありません。
概要
Key features include visual BUY/SELL markers with price labels, star ratings indicating filter confluence, ATR-based stops (default 1.5x ATR), and three profit targets at 1:1, 1:2, and 1:3 risk-reward ratios. It also displays a 200 EMA colored by price position, shaded risk and reward zones, and a two-column dashboard showing live signals, filters, and trade progress.
Signals are generated on confirmed closed bars without repainting, and alerts can be configured for nine different events. The indicator supports volume filtering where available and includes 65 customizable parameters covering pivot detection, line display, filters, risk management, and alerts. Apex Break PRO is intended for traders who manually draw trendlines and seek consistent, scored breakout signals for analysis and trade planning. It does not execute trades or access accounts.


























![「[Hamster-Coder] Moving Average MTF」ロゴ](https://cdn.ctrader.com/image/webp/b11b98b1-194d-4b8e-b00e-d611826ad159_31226)

![「[Stellar Strategies] VBO」ロゴ](https://cdn.ctrader.com/image/webp/f034c012-94d4-445a-a01b-febd1cdedaef_36944)
