
説明
cTrader用高度なドンチャンゾーンインジケーター
精度で市場のトレンドとブレイクアウトをマスターしよう!
取引を次のレベルに引き上げるために、高度なドンチャンゾーンインジケーターを活用しましょう。これは、正確さ、柔軟性、効率性を求めるトレーダーのために設計された強力なツールです。この次世代インジケーターは、クラシックなドンチャンチャネルを強化し、マルチタイムフレーム分析、カスタマイズ可能な価格計算、リアルタイムアラート、およびクラウドビジュアライゼーションを導入しています。
あなたが外国為替、株式、または商品のいずれを取引していても、高度なドンチャンゾーンインジケーターは、ブレイクアウトの特定、トレンドの追従、反転取引をプロのように行うためのツールを提供します。
主な特徴と利点:
1. マルチタイムフレームドンチャンゾーン
- 低い時間軸で取引しながら、より高い時間軸のドンチャンゾーンを分析し、常に大きな市場トレンドに合わせることができます。
- エントリーとエグジットを最適化したいデイトレーダーやスイングトレーダーに最適です。
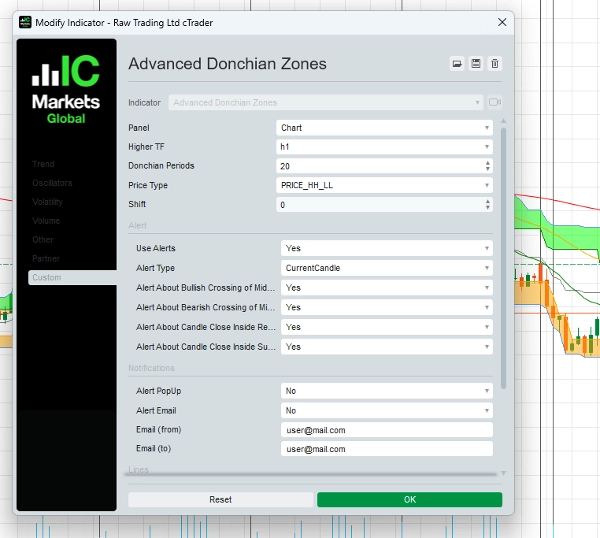
2. カスタマイズ可能な価格計算
- 戦略を洗練させるために、5つの高度な価格タイプから選択できます:
-
- 最高値/最安値
- 高値/始値または高値/終値の平均
- 最高の始値/最低の始値
- 最高の終値/最低の終値
- インジケーターをあなたの取引スタイルとリスク管理に合わせて調整できます。
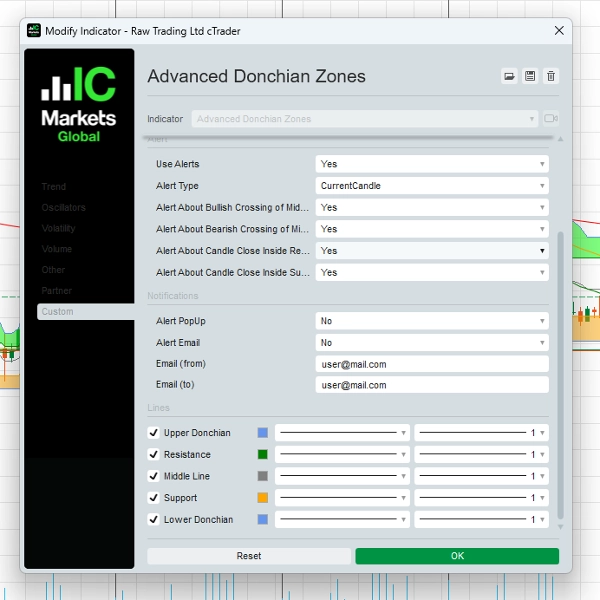
3. ダイナミックアラート – チャンスを見逃さない!
- 重要な取引イベントが発生したときにリアルタイム通知を受け取れます:
-
- ミッドラインのクロスオーバー(強気または弱気のシグナル)
- 価格が重要ゾーン内で終値をつける(反転またはブレイクアウトの可能性のあるゾーン)
- ポップアップやメールでアラートを受け取れ、市場の動きに先んじることができます。
4. 明確な洞察のためのクラウドビジュアライゼーション
- ドンチャンレベル間のユニークなシェードゾーンにより、トレーダーはサポート、レジスタンス、ブレイクアウトエリアを迅速かつ効果的に視覚的に識別できます。
5. 柔軟なシフトパラメーター
- ドンチャンゾーンの位置を時間軸で前後に調整して、取引戦略を微調整できます。
6. 使いやすいインターフェース
- すべてのレベルのトレーダー向けに設計られており、直感的なレイアウトとカスタマイズ可能な設定で取引の好みに合わせられます。
高度なドンチャンゾーンインジケーターの使い方
1. ブレイクアウト取引戦略 – 爆発的な動きを捉えよう!
- 設定:
-
- チャートに高度なドンチャンゾーンインジケーターを適用します。
- より正確なシグナルのために、ドンチャン期間(例:20)と高い時間軸(例:1時間または4時間)を選択します。
- エントリー:
-
- ロングエントリーは価格が上部ドンチャンゾーンを上抜けて終値をつけたときに行います。
- ショートエントリーは価格が下部ドンチャンゾーンを下抜けて終値をつけたときに行います。
- エグジット:
-
- エグジットレベルとしてミッドラインまたは反対側のドンチャンゾーンを使用します。
- 例:
-
- 15分足チャートを取引する場合、ドンチャン計算を1時間足の時間軸に基づいて設定します。価格が上部ドンチャンレベルを上抜けたら、ミッドライン近くにストップロスを置いて買い取引を開始します。
2. トレンドフォロー戦略 – 市場の勢いに乗ろう
- 設定:
-
- トレンドフィルターとしてミッドラインを使用します。
- 優勢なトレンドの方向にのみ取引します。
- エントリー:
-
- ロングエントリーは価格がミッドラインの上にあり、サポートゾーンで反発したときに行います。
- ショートエントリーは価格がミッドラインの下にあり、レジスタンスゾーンで反発したときに行います。
- エグジット:
-
- 価格が反対方向にミッドラインを横切ったときに取引を終了します。
- 例:
-
- 4時間足チャートでは、価格がミッドラインの上にあり、上昇トレンドを確認します。価格がサポートゾーンに戻り、反転の兆候を示したら買い取引を開始します。
3. レンジ相場取引戦略 – 横ばい市場で利益を上げる
- 設定:
-
- 価格が上部と下部のドンチャンゾーンの間で変動している期間を特定します。
- エントリー:
-
- ロングエントリーは価格がサポートに近づいたときに行います。
- ショートエントリーは価格がレジスタンスに近づいたときに行います。
- エグジット:
-
- 反対側のドンチャンゾーン近くまたはブレイクアウトが発生したときに利益を確定します。
- 例:
-
- 1時間足チャートで価格が上部と下部のドンチャンレベルの間で振動している場合、これらの極端なポイントで取引を行い、平均回帰の機会を狙います。
なぜトレーダーは高度なドンチャンゾーンを選ぶのか
✔ さまざまな取引スタイルに対応 – ブレイクアウト、トレンドフォロー、レンジ取引に対応します。
✔ 取引の精度を向上 – 重要なサポート&レジスタンスレベルを正確に特定します。
✔ リアルタイムアラート – 即時通知で情報を常に把握できます。
✔ プロフェッショナルグレードのツール – 市場で優位性を求めるトレーダーのために開発されました。
価格と限定オファー
特別限定価格: 97ドル(一括払い)
含まれるもの:
- cTrader用高度なドンチャンゾーンインジケーター
- ステップバイステップの戦略を含む包括的なユーザーガイド
- 1年間の無料アップデート
- 優先メールサポート
トレーダーの声
「私は長年ドンチャンチャネルを使っていますが、このインジケーターは別次元です。マルチタイムフレーム機能は革命的です!」
— マーク・S、外国為替トレーダー
「アラートとカスタマイズ可能な価格設定のおかげで、ブレイクアウト取引をより自信を持って行えます。真剣なトレーダーに強くおすすめします。」
— リサ・T、スイングトレーダー
今すぐ始めましょう!
取引を変革する準備はできましたか? 以下のボタンをクリックして高度なドンチャンゾーンインジケーターを購入し、精度の高い取引を始めましょう!
[97ドルで今すぐ購入]
30日間返金保証
私たちは製品に自信を持っています。完全に満足いただけない場合は、30日以内にご連絡いただければ、全額返金いたします。質問は一切ありません。
サポートが必要ですか?お問い合わせください!
📧 メール: o.elmottaqy@gmail.com
🌐 ウェブサイト: https://t.me/mottaqyo
リスク免責事項
取引にはリスクが伴います。 高度なドンチャンゾーンインジケーターは取引判断を支援するツールですが、利益を保証するものではありません。常に適切なリスク管理を行い、責任を持って取引してください。
概要
Key functionalities include real-time alerts via pop-ups and email for significant events such as midline crossovers and price closing inside key zones, helping traders stay informed of potential breakouts or reversals. A unique cloud visualization feature shades zones between Donchian levels to clearly identify support, resistance, and breakout areas. The flexible shift parameter allows users to adjust the positioning of Donchian Zones forward or backward in time for strategy fine-tuning.
Suitable for forex, stocks, and commodities markets, this indicator supports multiple trading strategies including breakout, trend-following, and range-bound trading. It features an intuitive interface designed for traders of all levels. The product includes a comprehensive user guide with step-by-step strategies, free updates for one year, and priority email support.
カスタマーレビュー
5 | 50 % | |
4 | 50 % | |
3 | 0 % | |
2 | 0 % | |
1 | 0 % |


