
MACD Indicators for cTrader
Find MACD indicators that help read trend strength and momentum changes on the chart. Compare classic MACD, histogram variants, multi-timeframe views, and alert-enabled chart tools that support different trading strategy approaches. Useful for confirming direction, filtering entries, and timing exits across Forex pairs, XAUUSD, and major indices.
Alat
Perbandingan alat
Soalan Lazim













Perbandingan alat
Produk | Ulasan | Muat turun | Jualan | Harga | Platform yang serasi |
|---|---|---|---|---|---|
MACD Indicator NDH | 5.0 (3) | 657 | — | Percuma | Windows, Mac |
MACDVolume | 5.0 (3) | — | 21 | $19 | Windows, Mac |
MACD Plus | 5.0 (2) | 598 | — | Percuma | Windows, Mac |
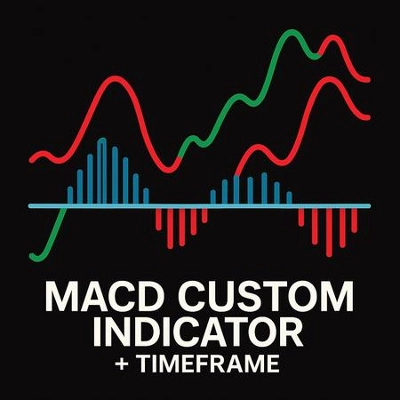
MacD Custom Indicator Multi Time Frame | 5.0 (2) | — | 8 | $19 | Windows, Mac |
IR Macd + MacdLine | 5.0 (2) | 506 | — | Percuma | Windows, Mac |
MACD Pro Trader | 4.6 (5) | — | 6 | $19 | Windows, Mac |
IR Macd on Chart | 5.0 (1) | 476 | — | Percuma | Windows, Mac |
MACD - advanced | 4.3 (6) | — | 5 | $20 | Windows, Mac |
Simple MACD Histogram | — | 288 | — | Percuma | Windows, Mac |
SmartBot-Volume MACD | 4.3 (3) | — | 5 | $19 | Windows, Mac |
Waddah Attar Explosion | — | 195 | — | Percuma | Windows, Mac |
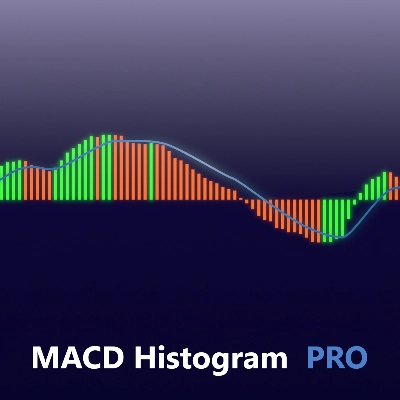
MACD Histogram PRO | 4.3 (3) | — | 4 | $19 | Windows, Mac |
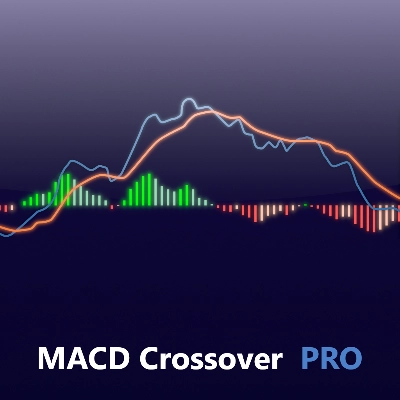
MACD Crossover PRO | 4.8 (4) | — | 4 | $19 | Windows, Mac |
SmartBot-MACD & RSI Indicator | 4.4 (5) | — | 4 | $19 | Windows, Mac |
Aggressive Entry Momentum MACD Power Guide | 5.0 (2) | — | 3 | $19 | Windows, Mac |
TradingViewMACD | 5.0 (1) | — | 3 | $19 | Windows, Mac |
Divergence Suite VPro | 4.5 (4) | — | 3 | $25 | Windows, Mac |
Osvolt Trend Hunter | 4.6 (5) | — | 2 | $45 | Windows, Mac |
MACD Custom Indicator - Multiple Time Frame | 4.3 (4) | — | 1 | $29 | Windows, Mac |
SMC + FVG Binary Signal Pro | 4.0 (4) | — | 1 | $29 | Windows, Mac |
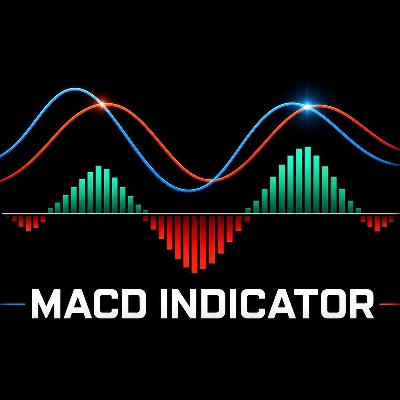
MACD Indicator | — | — | 1 | $19 | Windows, Mac |
macdZR | 4.6 (5) | — | 1 | $19 | Windows, Mac |
MACD Based Price Forecasting | — | — | — | dari $9 | Windows, Mac |
TrendMomentumScore | 4.5 (2) | — | — | $19 | Windows, Mac |
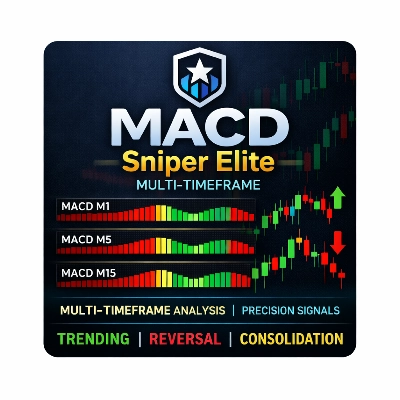
MACD Sniper Elite Multi-Timeframe | 4.5 (2) | — | — | $49 | Windows, Mac |
MACD x Volume Profile | — | — | — | $45 | Windows, Mac |
Soalan Lazim
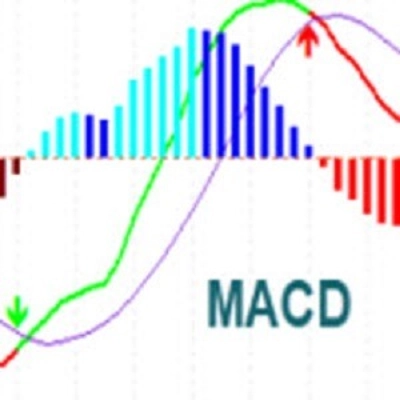
MACD, short for moving average convergence divergence, is the gap between a fast and a slow exponential moving average of price, classically twelve and twenty-six periods. A signal line, usually a nine-period average of that gap, is drawn alongside, and crossings between the two are read as momentum shifts.
Shrinking bars mean momentum in the current direction is fading, though that can precede a pause as easily as a reversal. In cTrader's built-in version the bars show the fast average minus the slow one, with a signal line on top, while the classic histogram plots the gap between MACD and its signal line.
Not by itself; an alert is just a notification that the two lines crossed, and the indicator sends nothing to the market. A crossover rule could be automated only through a separate cBot that you backtest, configure and start yourself, and losses would still be possible.
Shorter fast, slow or signal periods give earlier but noisier crossings, while longer ones smooth whipsaws at the cost of later turns. Because MACD is measured in price units, its readings cannot be compared across instruments, and it has no fixed overbought or oversold levels.
Attach it to several instruments and chart periods in the desktop app, scroll back, and note how often crossings came late or quickly reversed. Store indicators need cTrader on Windows or Mac, and free or trial versions allow this review before paying.