


Opis
Apex Break PRO rysuje istotne linie trendu i ocenia każde ich przebicie.
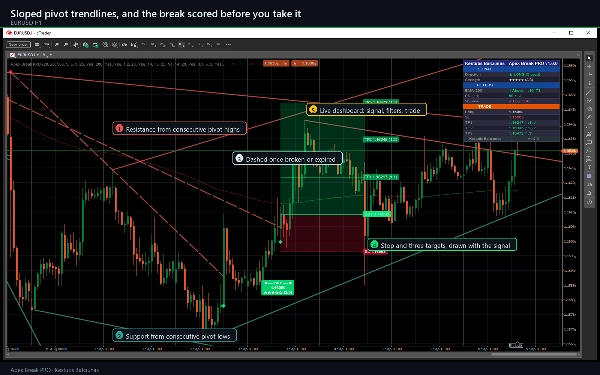
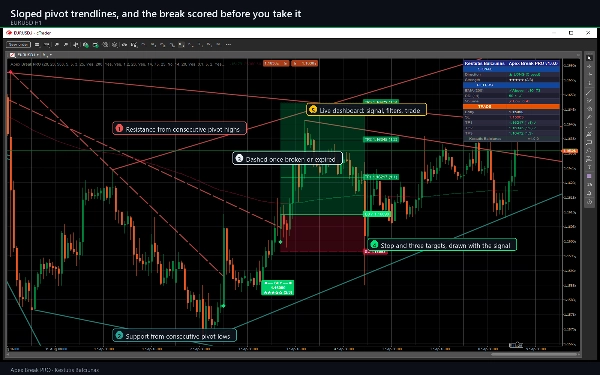
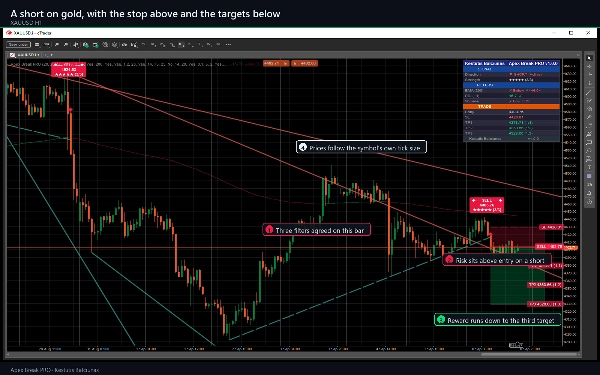
Kolejne szczyty pivot tworzą nachyloną linię oporu, kolejne dołki pivot nachyloną linię wsparcia. Nie są to poziomy poziome: podążają za własnym kierunkiem rynku i wygasają. Sygnał pojawia się, gdy zamknięcie POTWIERDZONEGO słupka przebija jedną z tych linii z marginesem mierzonym w ATR, i tylko wtedy, gdy zgadza się wystarczająca liczba niezależnych filtrów.
Co rysuje na Twoim wykresie
- Nachylone linie oporu i wsparcia, do pięciu każdej z nich, ciągłe gdy są aktywne i przerywane po ich przebiciu lub wygaśnięciu.
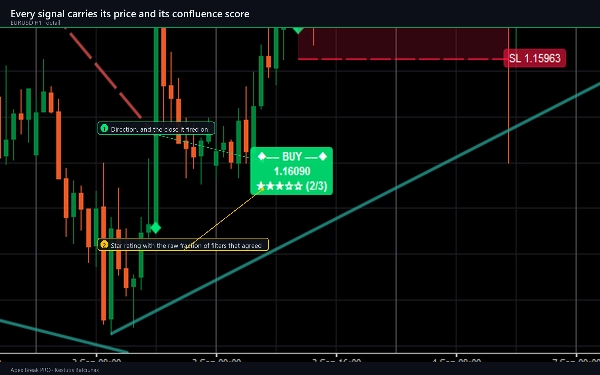
- Marker KUPNA lub SPRZEDAŻY z etykietą zawierającą cenę, oceną pięciogwiazdkową i ułamkiem konfluencji, na przykład 3/4.
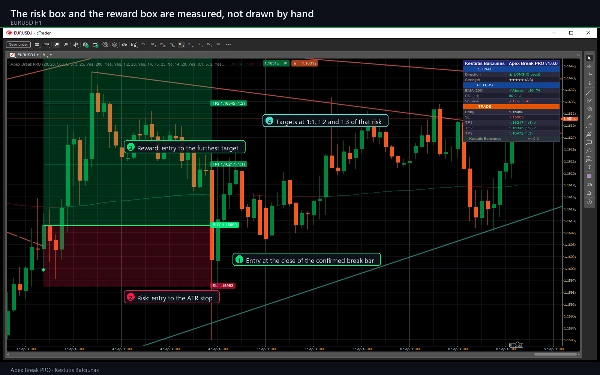
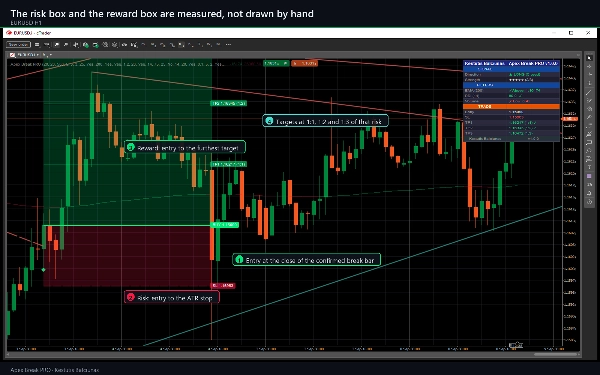
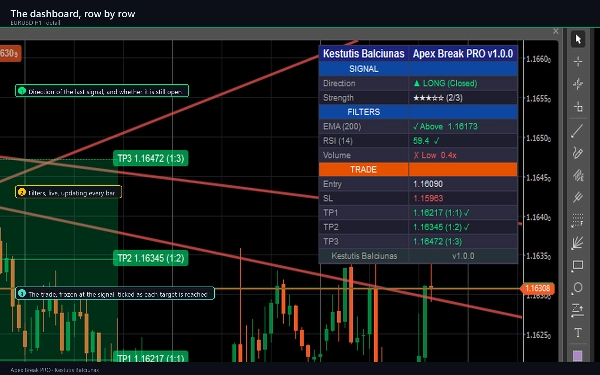
- Stop, domyślnie na poziomie 1,5 x ATR, oraz trzy cele na poziomach 1:1, 1:2 i 1:3 tej odległości, z zacienioną strefą ryzyka i strefą zysku.
- 200 EMA, kolorowana w zależności od tego, po której stronie ceny się znajduje.
- Dwukolumnowy panel z sekcją SYGNAŁ, aktywną sekcją FILTRY oraz sekcją TRANSAKCJE, która oznacza każdy cel po jego osiągnięciu.
Jak handlować z jego pomocą
- Daj mu historię. Przy domyślnych ustawieniach potrzebuje około 250 słupków, zanim pojawi się pierwsza linia, ponieważ 200 EMA musi się zainicjować, a pivot jest potwierdzany dopiero 20 słupków po jego utworzeniu.
- Czekaj na marker. Przebicie jest oceniane na zamkniętym słupku, więc marker nie przesuwa się po jego wydrukowaniu.
- Przeczytaj ocenę gwiazdkową i wiersze FILTRÓW zanim podejmiesz działanie. Wynik mówi, ile z włączonych warunków zgodziło się na tym słupku. To opis zgody, a nie prawdopodobieństwo.
- Używaj narysowanego stopa i celów tak, jak są, lub jako szablonu do własnego określania wielkości pozycji.
- Obserwuj wiersze TRANSAKCJI. Każdy cel jest oznaczany, gdy cena go osiąga, a śledzenie zatrzymuje się na stopie lub trzecim celu.
- Włącz alerty, które chcesz. Dostępnych jest dziewięć oddzielnych zdarzeń.
Kluczowe ustawienia
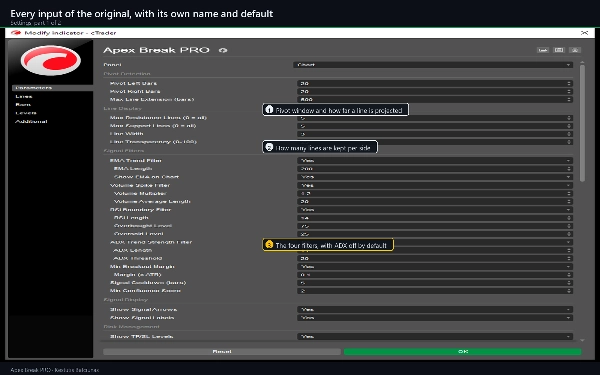
- Wykrywanie pivotów: lewy i prawy słupek, oba po 20, oraz maksymalne wydłużenie linii do 500 słupków.
- Wyświetlanie linii: do 5 linii oporu i 5 wsparcia, szerokość 3, przezroczystość 25.
- Filtry sygnału: EMA 200; RSI 14 z granicami 75 i 25; wolumen 1.2x średniej z 20 słupków; ADX 14 powyżej 20, domyślnie wyłączony; margines przebicia 0,1 x ATR; 5-słupkowy okres chłodzenia; minimalny wynik 2.
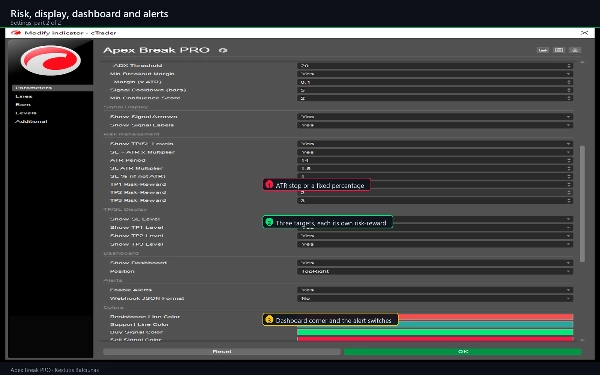
- Zarządzanie ryzykiem: ATR 14, stop na poziomie 1,5 x ATR lub stały procent, cele na poziomach 1:1, 1:2 i 1:3.
- Panel w sześciu pozycjach, dziewięć przełączników alertów oraz cztery kolory linii i sygnałów.
Łącznie 65 parametrów, obejmujących wykrywanie pivotów, wyświetlanie linii, filtry sygnału, zarządzanie ryzykiem, wyświetlanie TP/SL, panel, dziewięć przełączników alertów z kanałami dostarczania oraz kolory.
Typ wskaźnika, okresy, instrumenty, zastosowania
Wskaźnik wsparcia i oporu, trendu i zmienności, który rysuje na głównym wykresie i generuje sygnały. Działa na dowolnym symbolu i dowolnym interwale czasowym. M15, H1 i H4 to okna, dla których został zaprojektowany; niższe okresy dają więcej sygnałów z ciaśniejszymi stopami ATR, D1 i wyższe dają mniej i szersze. Filtr wolumenu jest używany tam, gdzie broker dostarcza wolumen i może być wyłączony tam, gdzie go nie ma. Typowe zastosowania: wejścia po przebiciu linii trendu z określoną konfluencją, ustawianie stopów na podstawie ATR, etapowe wyjścia na poziomach 1:1, 1:2 i 1:3, potwierdzenie na wyższym interwale oraz zasilanie cBota z ukrytego wyjścia sygnału.
Dla kogo jest przeznaczony
Dla traderów, którzy już ręcznie rysują linie trendu i chcą, aby były one rysowane tak samo na każdym wykresie, za każdym razem, z oceną przebicia przed podjęciem działania. To narzędzie analityczne: nigdy nie składa, nie modyfikuje ani nie zamyka zlecenia i nie ma dostępu do Twojego konta.
Wersja próbna: co dodaje pełna wersja
Wersja próbna to ta sama kompilacja, ograniczona do EURUSD, bez limitu czasowego i z dostępnymi wszystkimi parametrami. Na innych symbolach pokazuje powiadomienie zamiast rysować. Pełna wersja usuwa blokadę symbolu: każda para forex, indeks, metal, energia i symbol kryptowaluty oferowany przez Twojego brokera.
Uwagi techniczne i ograniczenia
- Sygnały są oceniane na zamkniętych słupkach i nie są przerysowywane. Pivot jest potwierdzany dopiero po utworzeniu Pivot Right Bars, a to opóźnienie potwierdzenia to cena za brak przerysowywania. Same linie trendu są tymczasowe na słupku w trakcie formowania.
- Alerty uruchamiają się tylko dla słupków zamkniętych po dołączeniu wskaźnika, nigdy dla historii.
- Znaczniki na wierszach celów zapisują, że cena później dotknęła narysowanego poziomu w historii na Twoim wykresie. Nie są to wyniki transakcji: nie uwzględniają spreadu, prowizji, swapu, poślizgu ani realizacji, i nie są z nich wyprowadzane statystyki.
- Wykres zachowuje najnowsze etykiety sygnałów i linie trendu, usuwając najstarsze.
- Dwóch brokerów nie ma identycznych świec, więc sygnały na wykresie na żywo będą się różnić od tych samych wskaźników na innym feedzie. To różnica danych, a nie różnica w obliczeniach.
- Wymagania: cTrader 5.0 lub nowszy, testowany na 5.9. Uprawnienia dostępu: brak - brak dostępu do plików, sieci lub handlu.
Wsparcie
Pytania przez zakładkę Dyskusja na tej stronie lub Zapytaj sprzedawcę. Aktualizacje są bezpłatne i wymienione w historii wersji. Sklep oferuje 14-dniowy okres zwrotu pieniędzy. Jeśli wskaźnik działa dla Ciebie, ocena pomaga innym traderom go znaleźć.
Trading wiąże się z ryzykiem. Wyniki z przeszłości nie gwarantują wyników w przyszłości.
Podsumowanie
Key features include visual BUY/SELL markers with price labels, star ratings indicating filter confluence, ATR-based stops (default 1.5x ATR), and three profit targets at 1:1, 1:2, and 1:3 risk-reward ratios. It also displays a 200 EMA colored by price position, shaded risk and reward zones, and a two-column dashboard showing live signals, filters, and trade progress.
Signals are generated on confirmed closed bars without repainting, and alerts can be configured for nine different events. The indicator supports volume filtering where available and includes 65 customizable parameters covering pivot detection, line display, filters, risk management, and alerts. Apex Break PRO is intended for traders who manually draw trendlines and seek consistent, scored breakout signals for analysis and trade planning. It does not execute trades or access accounts.
























![Logo „[Hamster-Coder] Pivot Points MTF”](https://cdn.ctrader.com/image/webp/4c143e5a-309c-40e3-a578-f04d1e133ffa_31159)




