Description
Professional Range-Based Volume Analysis with Smart Candle Delta Calculation
Unlock the power of precise volume analysis with RANGE DELTA CANDLE VOLUME PROFILE, the ultimate range-based volume profile indicator for cTrader. Designed for traders who need flexible, accurate volume analysis across custom time ranges, this indicator delivers institutional-grade insights through intelligent candle-based delta calculation.
🎯 KEY FEATURES
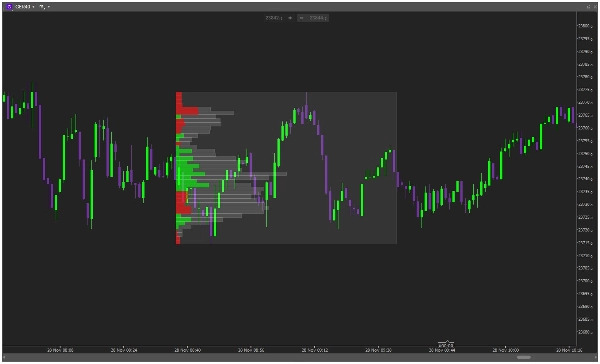
🏓 FLEXIBLE RANGE ANCHORING
- Use trendlines to define ANY custom time range
- Dynamic profile generation between your chosen points
- Real-time updates as market develops
- Left or Right anchoring options
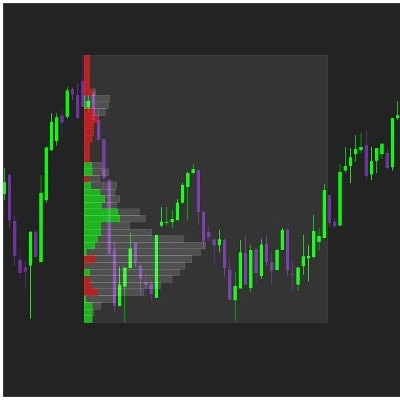
📊 SMART CANDLE-BASED DELTA ANALYSIS
- Advanced delta calculation based on candle direction
- Green candles = Buy Volume | Red candles = Sell Volume
- Clean, single-color visualization per price level
- Instant identification of accumulation/distribution zones
🎨 FULLY CUSTOMIZABLE DISPLAY
- Adjustable number of bins/lines (5-100)
- Customizable profile width (5-300% of range)
- Complete color control for buy/sell/total volume
- Transparency and opacity settings
⚡ DUAL DISPLAY MODES
- Delta Mode: Visualize net buying/selling pressure
- Volume Mode: Traditional volume profile display
- Choose between Left or Right anchoring
🚀 WHY TRADERS CHOOSE IT
"The flexibility to analyze any custom range is game-changing. Perfect for session analysis and key market moves." - Professional Day Trader
"Finally, a range volume profile that actually makes sense. The candle-based delta is incredibly accurate." - Swing Trader
📈 IDEAL FOR
- Session Analysis - Analyze specific trading sessions (London, NY, Asia)
- Event-Based Trading - Study volume around news events and economic data
- Technical Analysis - Confirm support/resistance with volume validation
- Market Structure - Identify value areas and volume gaps
🛠 SIMPLE TO USE
- Draw a trendline between your start and end points
- Watch as the volume profile automatically generates
- Analyze the delta distribution across your custom range
- Trade with volume-confirmed levels and insights
🔧 TECHNICAL SPECIFICATIONS
- Real-time calculation and updates
- Low resource consumption
- Compatible with all timeframes
- Works with all trading instruments
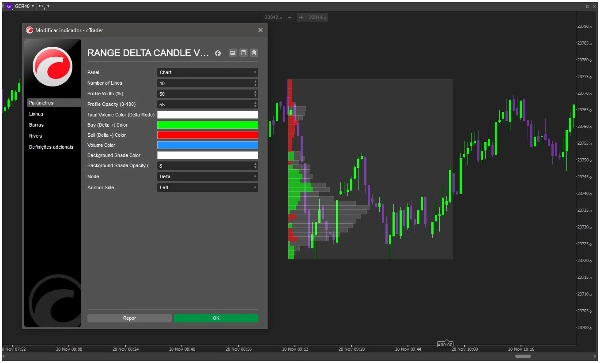
📋 CUSTOMIZATION OPTIONS
- Number of Bins/Lines
- Profile Width Percentage
- Opacity Controls (0-100%)
- Custom Color Schemes
- Anchor Side Selection (Left/Right)
- Display Mode (Delta/Volume)
🎯 ELEVATE YOUR MARKET ANALYSIS TODAY!
Join professional traders worldwide who have transformed their market analysis with RANGE DELTA CANDLE VOLUME PROFILE. Stop using rigid, fixed-range tools and start analyzing volume exactly where you need it.
⭐ "The ability to analyze custom ranges with accurate delta calculation has completely changed how I approach market structure. Essential tool!"
Add RANGE DELTA CANDLE VOLUME PROFILE to your cTrader platform today and master volume analysis across any market condition!
🆚 WHY CHOOSE THIS OVER OTHER VOLUME PROFILES?
- ✅ True Flexibility - Analyze ANY custom time range
- ✅ Accurate Delta - Candle-based calculation for reliable results
- ✅ Professional Visualization - Clean, institutional-grade display
- ✅ Real Customization - Complete control over all visual aspects
- ✅ Proven Methodology - Based on professional trading principles
Transform your chart analysis with the power of flexible range-based volume profiling!


