present
Sign up and get $50 off your first purchase
Trading product for AW Multi Data Indicator, image 1
AW Multi Data
5.62K
Free installs

Description

Summary

AI summary
AW Multi Data is a trading indicator that displays key trading metrics directly on your chart. It shows the current symbol and timeframe, daily net profit percentage, daily net profit amount, and spread. The indicator requires the timezone to be set to UTC to accurately reflect daily profit values. This tool provides real-time performance data to assist traders in monitoring their trades within the charting interface.
Indicator profile

Discussion

Customer reviews

0.0
Reviews: 0
Customer reviews
No reviews for this product yet. Already tried it? Be the first to tell others!

FAQ

Products available through cTrader Store, including trading bots, indicators and plugins, are provided by third-party developers and made available for informational and technical access purposes only. cTrader Store is not a broker and does not provide investment advice, personal recommendations or any guarantee of future performance.


More from this author

with this indicator you could see other time frame candle in your chart.
show spread on chart
some user add moving average to macd to see better. in ctrader 4.3.11 there is a problem with this . I make a macd tha
this indicator show macd on chart.
Multi Time Frame Moving Average is a powerful and flexible indicator for cTrader
 this moving include everything that a trader needs from Moving Average.
this indicaotr show distance between Tenkan to Kijun, Close to Kijun and Close to Tenkan 
Add Slowing to IR Moving Average.
IR Candle Open plots customizable opening price lines for daily, weekly, and monthly candles
Coral indicator
you could put your check list in your chart you could split your test with “,” you could put your checklist in indicat
this indicator show other time frame close in lower time frame. for ex: show daily close in m 15.

You may also like

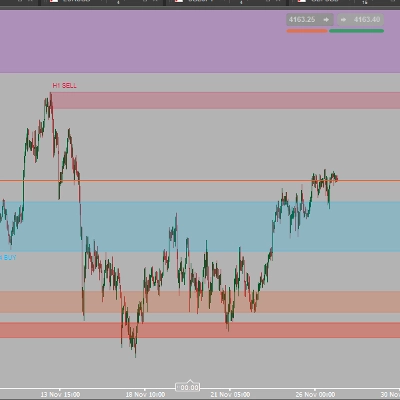
Heatmap Pro analiza la volatilidad, el volumen y la acción del precio para "pintar" tu gráfico con zonas de color.
Configure, simulate, and analyze trading strategies with custom filters, multi-target exits, and detailed performance me
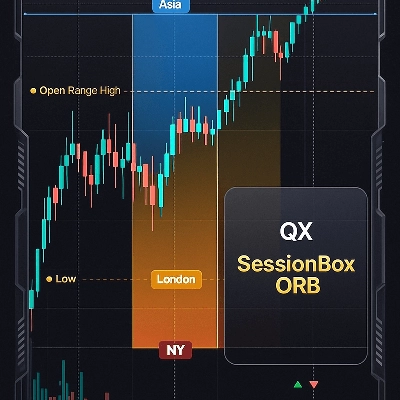
QX SessionBox ORB: Session boxes + ORB levels + clean dashboard with optional closed-candle breakout signals.
Custom and native timeframes display with OHLC lines, moving averages, and Fibonacci levels.
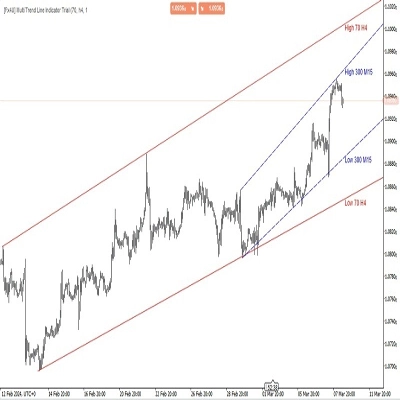
Allow trader to draw multi trendlines in different timeframes on one chart,Give trader an overview of the current market
Identify key support and resistance levels through detailed volume distribution analysis.
Most used candle patterns. (1 candle, 2 candles and 3 candles patterns) and Marubozu. Bonus Fibo Risk control.
Weis Wave indicator based on the original work of David Weis.
Strong Supertrend Turn Market Movement into a Clear Map Market analysis
KILLZONES AND MACRO SESSIONS
The QQE indicator is a technical analysis tool designed to identify potential trend changes and trading signals 📈📉
Super Trend Rsi ,ATR + trend change distance + dynamic Alpha, divergence/convergence
Angora Pattern Recognition is a cTrader indicator that finds, draws and tracks classic chart patterns automatically.
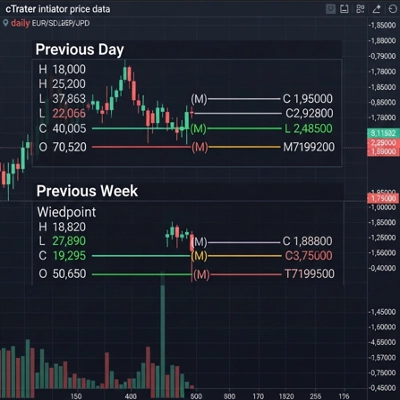
The Weekly Daily Levels indicator shows the OHLC, and mid-point prices for the previous day and week.
Outside Candle Detector: Highlights major candles/zones with ATR filter & pattern labels. By Avydel Talbo, prop trader.
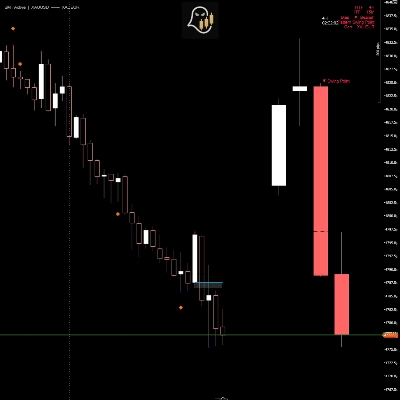
GOLD SENTINEL v1.0 - A CANDLE-COLORING INDICATOR FOR GOLD.
Detects HTF bias using CRT, Expansion & Swing Point patterns with SMT/PSP divergence — visualised in a floating candle
Enhance your trading with customizable alerts and dynamic visual tools for trendlines, Fibonacci levels, and more.

Price

5.62K
Free installs