
Descrição
Apex Break PRO desenha as linhas de tendência que importam e pontua cada rompimento delas.
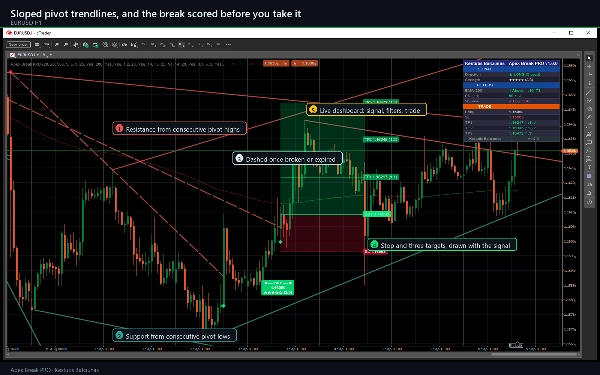
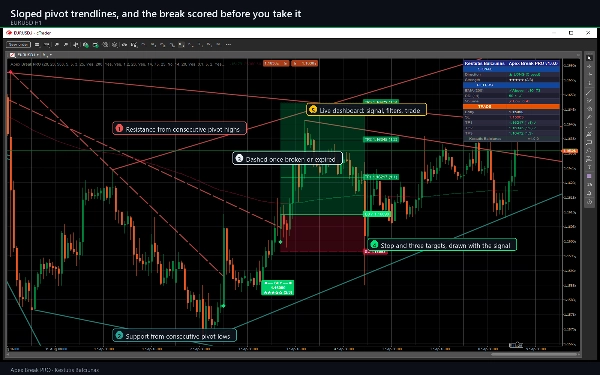
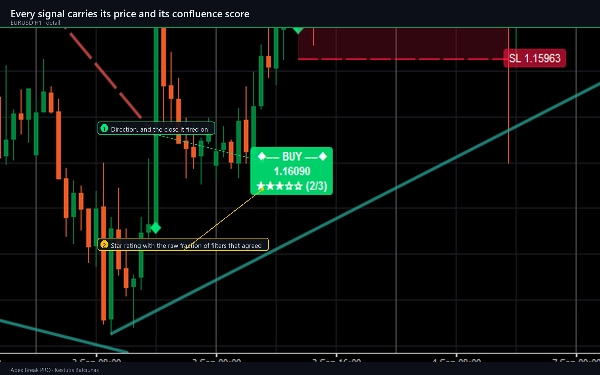
Picos consecutivos formam uma linha de resistência inclinada, vales consecutivos uma linha de suporte inclinada. Estes não são níveis horizontais: eles seguem a própria direção do mercado e expiram. Um sinal aparece quando o fechamento de uma barra CONFIRMADA ultrapassa uma dessas linhas por uma margem medida em ATR, e somente quando filtros independentes suficientes concordam.
O que ele desenha no seu gráfico
- Linhas de tendência de resistência e suporte inclinadas, até cinco de cada, sólidas enquanto estiverem ativas e tracejadas uma vez que são rompidas ou atingem sua extensão máxima.
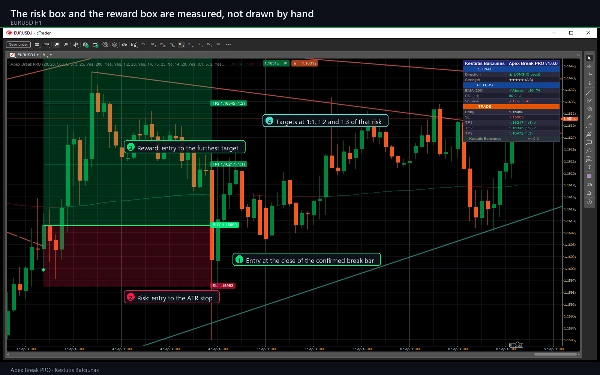
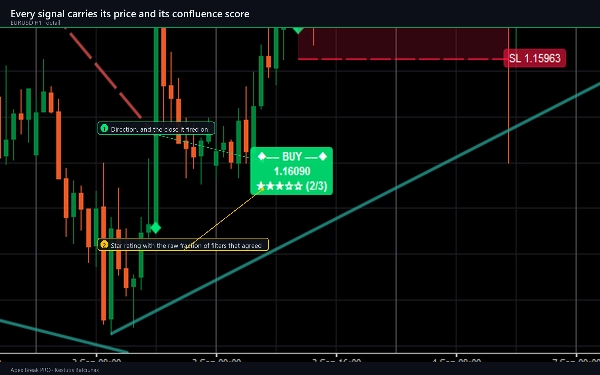
- Um marcador de COMPRA ou VENDA com um rótulo contendo o preço, uma classificação de cinco estrelas e a fração de confluência, por exemplo 3/4.
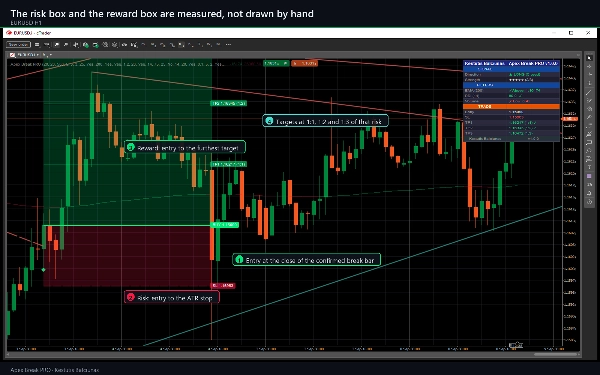
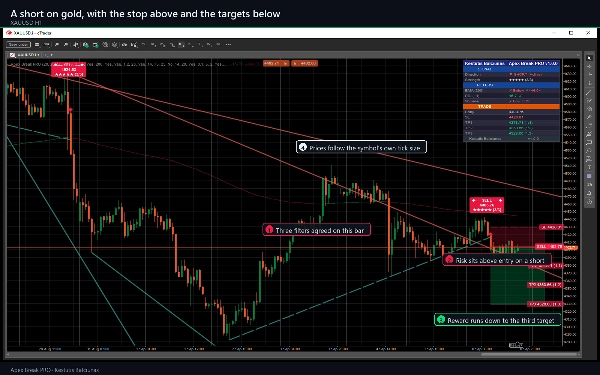
- O stop, por padrão em 1,5 x ATR, e três alvos em 1:1, 1:2 e 1:3 dessa distância, com uma zona de risco sombreada e uma zona de recompensa sombreada.
- A EMA 200, colorida de acordo com o lado em que o preço está negociando.
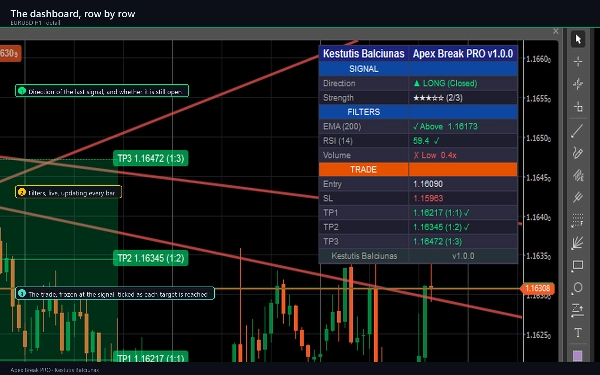
- Um painel de duas colunas com uma seção de SINAL, uma seção de FILTROS ao vivo e uma seção de NEGÓCIOS que marca cada alvo conforme é alcançado.
Como negociar com ele
- Dê-lhe histórico. Nas configurações padrão, ele precisa de cerca de 250 barras antes que a primeira linha apareça, porque a EMA 200 precisa ser estabelecida e um pivô só é confirmado 20 barras após sua formação.
- Espere por um marcador. O rompimento é avaliado em uma barra fechada, então o marcador não se move uma vez que é impresso.
- Leia a classificação por estrelas e as linhas de FILTROS antes de agir. A pontuação indica quantas das condições habilitadas concordaram naquela barra. É uma descrição de concordância, não uma probabilidade.
- Use o stop e os alvos desenhados como estão, ou como um modelo para seu próprio dimensionamento.
- Observe as linhas de NEGÓCIOS. Cada alvo é marcado conforme o preço o alcança, e o acompanhamento para no stop ou no terceiro alvo.
- Ative os alertas que desejar. Nove eventos separados estão disponíveis.
Configurações principais
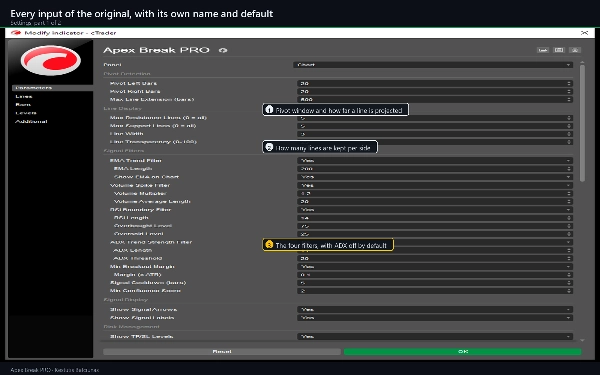
- Detecção de Pivô: barras à esquerda e à direita, ambas 20, e uma extensão máxima da linha de 500 barras.
- Exibição da Linha: até 5 linhas de resistência e 5 de suporte, largura 3, transparência 25.
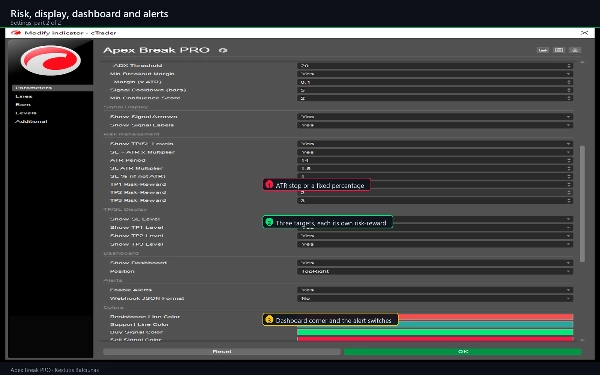
- Filtros de Sinal: EMA 200; RSI 14 com limites 75 e 25; volume 1.2x sua média de 20 barras; ADX 14 acima de 20, desligado por padrão; uma margem de rompimento de 0,1 x ATR; um cooldown de 5 barras; uma pontuação mínima de 2.
- Gestão de Risco: ATR 14, stop em 1,5 x ATR ou uma porcentagem fixa, alvos em 1:1, 1:2 e 1:3.
- Painel em seis posições, nove alternadores de alerta e as quatro cores de linha e sinal.
65 parâmetros no total, abrangendo detecção de pivô, exibição de linha, os filtros de sinal, gestão de risco, exibição de TP/SL, o painel, nove alternadores de alerta com seus canais de entrega, e as cores.
Tipo de indicador, períodos, instrumentos, casos de uso
Um indicador de suporte e resistência, tendência e volatilidade que desenha no gráfico principal e emite sinais. Funciona em qualquer símbolo e qualquer período. M15, H1 e H4 são a janela para a qual foi projetado; períodos menores dão mais sinais com stops ATR mais apertados, D1 e superiores dão menos e mais amplos. O filtro de volume é usado onde seu corretor fornece volume e pode ser desligado onde não fornece. Usos típicos: entradas por rompimento de linha de tendência com confluência declarada, posicionamento de stop baseado em ATR, saídas graduais em 1:1, 1:2 e 1:3, confirmação em timeframe superior e alimentação de um cBot a partir da saída de sinal oculta.
Para quem é
Traders que já desenham linhas de tendência manualmente e querem que elas sejam desenhadas da mesma forma em todos os gráficos, sempre, com o rompimento pontuado antes de agirem. É uma ferramenta de análise: nunca coloca, modifica ou fecha uma ordem, e não tem acesso à sua conta.
Versão de teste: o que a versão completa adiciona
A versão de teste é esta mesma compilação, limitada ao EURUSD, sem limite de tempo e com todos os parâmetros disponíveis. Em qualquer outro símbolo, mostra um aviso em vez de desenhar. A versão completa remove o bloqueio de símbolo: todos os pares forex, índices, metais, energia e símbolos de criptomoedas que seu corretor oferece.
Notas técnicas e limitações
- Os sinais são avaliados em barras fechadas e não repintam. Um pivô é confirmado somente após as Barras Direitas do Pivô terem se formado, e esse atraso na confirmação é o preço de não repintar. As próprias linhas de tendência são provisórias na barra ainda em formação.
- Os alertas disparam apenas para barras que fecham após você anexar o indicador, nunca para o histórico.
- As marcas nas linhas de alvo registram que o preço tocou posteriormente um nível desenhado no histórico do seu gráfico. Elas não são resultados de negociação: não envolvem spread, comissão, swap, slippage ou preenchimento, e nenhuma estatística é derivada delas.
- O gráfico mantém os rótulos de sinal e linhas de tendência mais recentes e elimina os mais antigos.
- Dois corretores não têm velas idênticas, então sinais em um gráfico ao vivo diferirão do mesmo indicador em outro feed. Isso é uma diferença de dados, não uma diferença no cálculo.
- Requisitos: cTrader 5.0 ou superior, testado na 5.9. Direitos de acesso: Nenhum - sem acesso a arquivos, rede ou negociação.
Suporte
Dúvidas através da aba Discussão desta página ou Pergunte ao vendedor. Atualizações são gratuitas e listadas no histórico de versões. A Loja oferece um período de reembolso de 14 dias. Se o indicador funcionar para você, uma avaliação ajuda outros traders a encontrá-lo.
Negociar envolve riscos. Desempenho passado não garante resultados futuros.
Resumo
Key features include visual BUY/SELL markers with price labels, star ratings indicating filter confluence, ATR-based stops (default 1.5x ATR), and three profit targets at 1:1, 1:2, and 1:3 risk-reward ratios. It also displays a 200 EMA colored by price position, shaded risk and reward zones, and a two-column dashboard showing live signals, filters, and trade progress.
Signals are generated on confirmed closed bars without repainting, and alerts can be configured for nine different events. The indicator supports volume filtering where available and includes 65 customizable parameters covering pivot detection, line display, filters, risk management, and alerts. Apex Break PRO is intended for traders who manually draw trendlines and seek consistent, scored breakout signals for analysis and trade planning. It does not execute trades or access accounts.