
Descrição
O Flux Gate Precision lê a faixa em que o mercado realmente negociou e informa quando o preço se compromete com uma das extremidades dela.
Como ele encontra um sinal
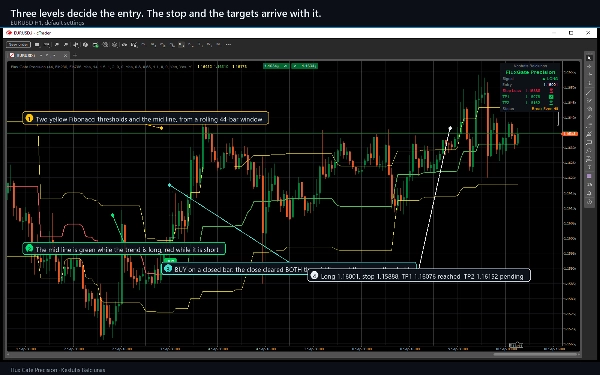
Uma janela móvel das últimas 44 velas fornece a máxima mais alta e a mínima mais baixa. Três níveis são medidos a partir dessa máxima: um limite superior de Fibonacci em 23,6 por cento, uma linha média em 50 por cento e um limite inferior em 78,6 por cento. O indicador desenha os três e colore a linha média de verde enquanto a tendência é de alta e de vermelho enquanto é de baixa.
Uma COMPRA precisa que uma barra feche acima de AMBOS a linha média e o limite superior. Uma VENDA precisa de um fechamento abaixo de AMBOS a linha média e o limite inferior. Exigir dois níveis em vez de um é o que mantém o indicador silencioso enquanto o preço oscila em torno do meio da faixa. Um estado de tendência também precisa mudar: ele não imprimirá uma segunda COMPRA até que uma VENDA tenha ocorrido, para que você não obtenha um agrupamento do mesmo sinal em um único movimento.
Cada decisão é tomada em uma barra FECHADA. Um marcador nunca aparece e depois desaparece.
O que vem com o sinal
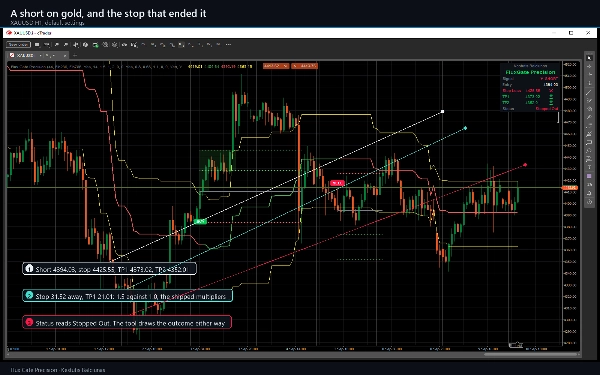
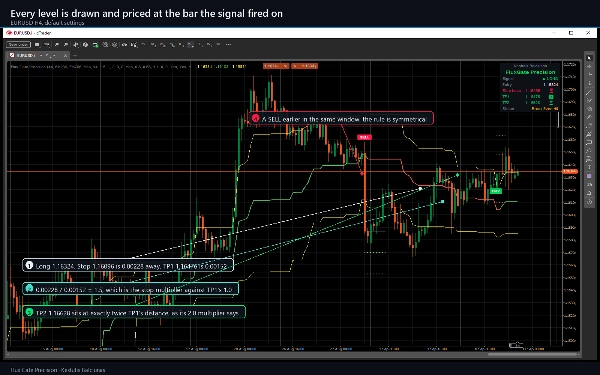
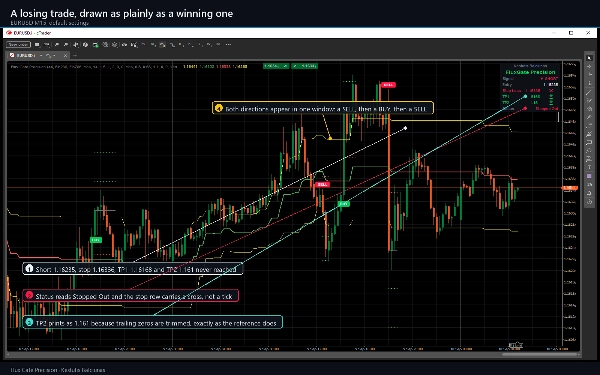
No momento em que um sinal é emitido, o indicador fixa uma entrada, um stop e até quatro take profits, e desenha cada um como uma linha rotulada com seu preço.
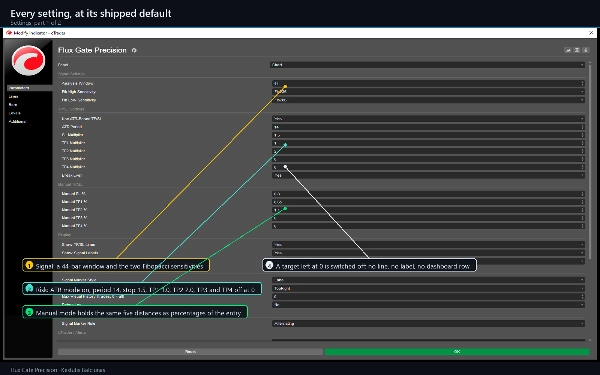
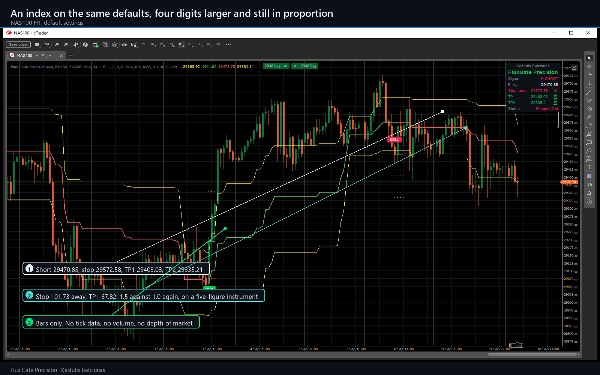
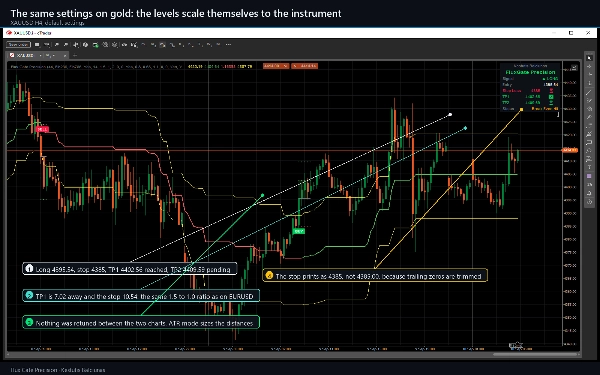
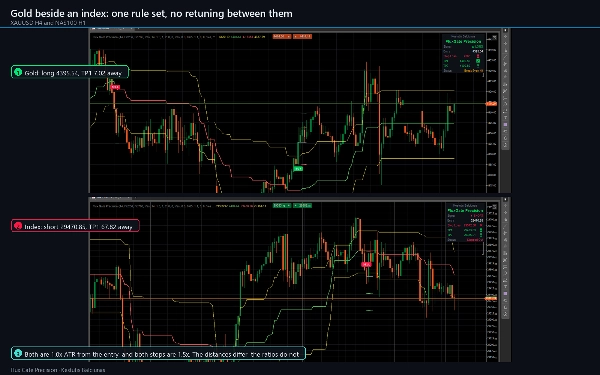
- O modo ATR, ativado por padrão, dimensiona o stop e os alvos a partir da volatilidade atual, para que as mesmas configurações se comportem de forma sensata em um gráfico de cinco minutos e em um diário, e em um par de moedas e no ouro.
- O modo manual os dimensiona como uma porcentagem fixa do preço de entrada, em vez disso.
- O stop padrão é 1,5 ATR, o primeiro alvo é 1,0 e o segundo é 2,0. O terceiro e o quarto ficam desligados até que você lhes dê um multiplicador.
A escada do ponto de equilíbrio
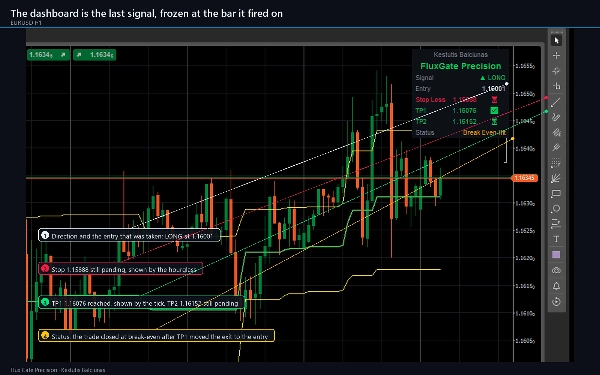
Com o Break Even ativado, a saída avança atrás da negociação: alcançar o primeiro alvo move o stop para a entrada, o segundo move para o primeiro alvo, o terceiro para o segundo, e alcançar o quarto fecha a negociação. Uma faixa sombreada é desenhada cada vez que um nível é alcançado, para que toda a vida da negociação permaneça legível no gráfico depois.
O painel de controle
Um painel no canto de sua escolha mostra o último sinal e o que aconteceu com ele desde então: direção, entrada, stop, cada alvo ativo com um tique quando o preço o alcança, e uma linha de status que lê Ativo, Todos os TPs Atingidos, Stopado, Break Even Atingido ou Mudança de Tendência.
Alertas
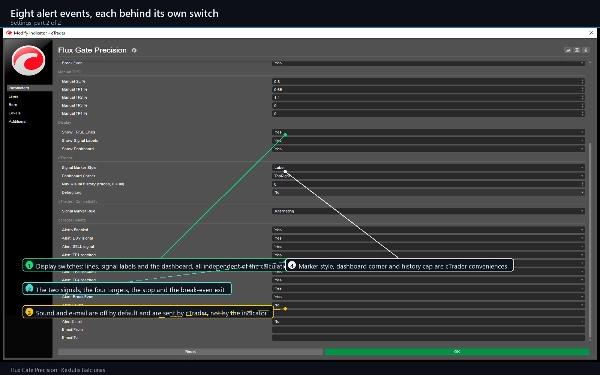
Oito eventos, cada um com seu próprio interruptor: os dois sinais, os quatro alvos, o stop e a saída no ponto de equilíbrio. Cada um dispara uma vez por barra fechada e nunca para o histórico, então anexá-lo a um gráfico longo não produz uma parede de alertas antigos. A entrega é pelo log do cTrader, um som opcional e e-mail opcional através das suas próprias configurações do cTrader.
Configurações
38 parâmetros em quatro grupos que você usará e três que provavelmente não tocará: a janela de análise e as duas sensibilidades de Fibonacci, o modo ATR e seus multiplicadores, as porcentagens manuais e três interruptores de exibição. O resto são conveniências do cTrader: um estilo de marcador, o canto do painel, um limite visual de histórico, um log de depuração e um interruptor por alerta.
Tipo, prazos e instrumentos
Um indicador sobreposto para análise de tendência e suporte e resistência. Ele precisa de cerca de 60 barras antes de desenhar, o que é pouco, então é utilizável em gráficos intradiários assim como em gráficos de swing. M15, H1 e H4 são a janela para a qual foi projetado; ele funciona em qualquer período e qualquer instrumento, e foi testado nos principais pares de FX, ouro e índices. Usa apenas barras: sem dados de ticks, sem volume, sem profundidade de mercado.
Para quem é
Traders que querem uma regra de entrada que possam expressar em uma frase, e que querem o stop e os alvos decididos no mesmo momento da entrada, e não depois.
A versão de teste
A edição de teste é esta mesma versão com uma restrição: funciona apenas no EURUSD, e sufixos de corretora como EURUSD.i são aceitos. Não há limite de tempo e todos os parâmetros estão disponíveis. A versão completa adiciona todos os outros símbolos.
Notas técnicas
Os sinais não se redesenham: são avaliados apenas em barras fechadas. Enquanto uma negociação está aberta, suas linhas de nível e seus rótulos se estendem para a direita com o gráfico, o que move o desenho, não os níveis. Durante as primeiras barras da janela ATR, o stop e os alvos ficam no preço de entrada até que a média tenha dados suficientes, e um alvo deixado com multiplicador zero fica desligado e não recebe linha, rótulo nem linha no painel.
O indicador não declara direitos de acesso. Ele não abre conexão de rede, não lê arquivos e nunca coloca, modifica ou fecha uma ordem. Os tiques no painel registram que o preço tocou um nível desenhado no histórico carregado, sem spread, comissão ou slippage.
Suporte
Dúvidas devem ser enviadas pela aba Discussão desta listagem. Por favor, inclua seu símbolo, período, corretora, versão do cTrader e uma captura de tela com o painel visível.
Negociar envolve riscos. Desempenho passado não garante resultados futuros.
Resumo
Upon signal generation, the indicator sets entry, stop-loss, and up to four take-profit levels, which are displayed as labeled lines on the chart. The stop and targets can be sized using ATR-based volatility or fixed percentage modes. The break-even ladder adjusts the stop progressively as targets are reached, visually marking each level on the chart.
A dashboard panel shows the latest signal status, including entry, stop, targets, and trade progress. Alerts can be configured for signals, targets, stops, and break-even exits, firing once per closed bar. The indicator works on any timeframe and instrument using bar data only and is suitable for intraday and swing trading. It has been tested on major FX pairs, gold, and indices.